Fake BreakoutThis indicator detect fake breakout on previous day high/low and option previous swing high and low
Rule Detect Fake Breakout On Previous Day High/Low Or Swing high low Fake Breakout -
1) Detect previous day high/low or swing high/low
2)
A) If price revisit on previous day high/swing high look for upside breakout after input
number of candle (1-5) price came back to previous high and breakout happen downside
it show sell because its fake breakout of previous day high or swing high
B) If price revisit on previous day low/swing low look for downside breakout after input
number of candle (1-5) price came back to previous low and breakout upside of previous
day low it show Buy because its fake breakout of previous day low or swing low
Disclaimer -Traders can use this script as a starting point for further customization or as a reference for developing their own trading strategies. It's important to note that past performance is not indicative of future results, and thorough testing and validation are recommended before deploying any trading strategy.
Recherche dans les scripts pour "swing high low"

Supertrend Advance Pullback StrategyHandbook for the Supertrend Advance Strategy
1. Introduction
Purpose of the Handbook:
The main purpose of this handbook is to serve as a comprehensive guide for traders and investors who are looking to explore and harness the potential of the Supertrend Advance Strategy. In the rapidly changing financial market, having the right tools and strategies at one's disposal is crucial. Whether you're a beginner hoping to dive into the world of trading or a seasoned investor aiming to optimize and diversify your portfolio, this handbook offers the insights and methodologies you need. By the end of this guide, readers should have a clear understanding of how the Supertrend Advance Strategy works, its benefits, potential pitfalls, and practical application in various trading scenarios.
Overview of the Supertrend Advance Pullback Strategy:
At its core, the Supertrend Advance Strategy is an evolution of the popular Supertrend Indicator. Designed to generate buy and sell signals in trending markets, the Supertrend Indicator has been a favorite tool for many traders around the world. The Advance Strategy, however, builds upon this foundation by introducing enhanced mechanisms, filters, and methodologies to increase precision and reduce false signals.
1. Basic Concept:
The Supertrend Advance Strategy relies on a combination of price action and volatility to determine the potential trend direction. By assessing the average true range (ATR) in conjunction with specific price points, this strategy aims to highlight the potential starting and ending points of market trends.
2. Methodology:
Unlike the traditional Supertrend Indicator, which primarily focuses on closing prices and ATR, the Advance Strategy integrates other critical market variables, such as volume, momentum oscillators, and perhaps even fundamental data, to validate its signals. This multidimensional approach ensures that the generated signals are more reliable and are less prone to market noise.
3. Benefits:
One of the main benefits of the Supertrend Advance Strategy is its ability to filter out false breakouts and minor price fluctuations, which can often lead to premature exits or entries in the market. By waiting for a confluence of factors to align, traders using this advanced strategy can increase their chances of entering or exiting trades at optimal points.
4. Practical Applications:
The Supertrend Advance Strategy can be applied across various timeframes, from intraday trading to swing trading and even long-term investment scenarios. Furthermore, its flexible nature allows it to be tailored to different asset classes, be it stocks, commodities, forex, or cryptocurrencies.
In the subsequent sections of this handbook, we will delve deeper into the intricacies of this strategy, offering step-by-step guidelines on its application, case studies, and tips for maximizing its efficacy in the volatile world of trading.
As you journey through this handbook, we encourage you to approach the Supertrend Advance Strategy with an open mind, testing and tweaking it as per your personal trading style and risk appetite. The ultimate goal is not just to provide you with a new tool but to empower you with a holistic strategy that can enhance your trading endeavors.
2. Getting Started
Navigating the financial markets can be a daunting task without the right tools. This section is dedicated to helping you set up the Supertrend Advance Strategy on one of the most popular charting platforms, TradingView. By following the steps below, you'll be able to integrate this strategy into your charts and start leveraging its insights in no time.
Setting up on TradingView:
TradingView is a web-based platform that offers a wide range of charting tools, social networking, and market data. Before you can apply the Supertrend Advance Strategy, you'll first need a TradingView account. If you haven't set one up yet, here's how:
1. Account Creation:
• Visit TradingView's official website.
• Click on the "Join for free" or "Sign up" button.
• Follow the registration process, providing the necessary details and setting up your login credentials.
2. Navigating the Dashboard:
• Once logged in, you'll be taken to your dashboard. Here, you'll see a variety of tools, including watchlists, alerts, and the main charting window.
• To begin charting, type in the name or ticker of the asset you're interested in the search bar at the top.
3. Configuring Chart Settings:
• Before integrating the Supertrend Advance Strategy, familiarize yourself with the chart settings. This can be accessed by clicking the 'gear' icon on the top right of the chart window.
• Adjust the chart type, time intervals, and other display settings to your preference.
Integrating the Strategy into a Chart:
Now that you're set up on TradingView, it's time to integrate the Supertrend Advance Strategy.
1. Accessing the Pine Script Editor:
• Located at the top-center of your screen, you'll find the "Pine Editor" tab. Click on it.
• This is where custom strategies and indicators are scripted or imported.
2. Loading the Supertrend Advance Strategy Script:
• Depending on whether you have the script or need to find it, there are two paths:
• If you have the script: Copy the Supertrend Advance Strategy script, and then paste it into the Pine Editor.
• If searching for the script: Click on the “Indicators” icon (looks like a flame) at the top of your screen, and then type “Supertrend Advance Strategy” in the search bar. If available, it will show up in the list. Simply click to add it to your chart.
3. Applying the Strategy:
• After pasting or selecting the Supertrend Advance Strategy in the Pine Editor, click on the “Add to Chart” button located at the top of the editor. This will overlay the strategy onto your main chart window.
4. Configuring Strategy Settings:
• Once the strategy is on your chart, you'll notice a small settings ('gear') icon next to its name in the top-left of the chart window. Click on this to access settings.
• Here, you can adjust various parameters of the Supertrend Advance Strategy to better fit your trading style or the specific asset you're analyzing.
5. Interpreting Signals:
• With the strategy applied, you'll now see buy/sell signals represented on your chart. Take time to familiarize yourself with how these look and behave over various timeframes and market conditions.
3. Strategy Overview
What is the Supertrend Advance Strategy?
The Supertrend Advance Strategy is a refined version of the classic Supertrend Indicator, which was developed to aid traders in spotting market trends. The strategy utilizes a combination of data points, including average true range (ATR) and price momentum, to generate buy and sell signals.
In essence, the Supertrend Advance Strategy can be visualized as a line that moves with the price. When the price is above the Supertrend line, it indicates an uptrend and suggests a potential buy position. Conversely, when the price is below the Supertrend line, it hints at a downtrend, suggesting a potential selling point.
Strategy Goals and Objectives:
1. Trend Identification: At the core of the Supertrend Advance Strategy is the goal to efficiently and consistently identify prevailing market trends. By recognizing these trends, traders can position themselves to capitalize on price movements in their favor.
2. Reducing Noise: Financial markets are often inundated with 'noise' - short-term price fluctuations that can mislead traders. The Supertrend Advance Strategy aims to filter out this noise, allowing for clearer decision-making.
3. Enhancing Risk Management: With clear buy and sell signals, traders can set more precise stop-loss and take-profit points. This leads to better risk management and potentially improved profitability.
4. Versatility: While primarily used for trend identification, the strategy can be integrated with other technical tools and indicators to create a comprehensive trading system.
Type of Assets/Markets to Apply the Strategy:
1. Equities: The Supertrend Advance Strategy is highly popular among stock traders. Its ability to capture long-term trends makes it particularly useful for those trading individual stocks or equity indices.
2. Forex: Given the 24-hour nature of the Forex market and its propensity for trends, the Supertrend Advance Strategy is a valuable tool for currency traders.
3. Commodities: Whether it's gold, oil, or agricultural products, commodities often move in extended trends. The strategy can help in identifying and capitalizing on these movements.
4. Cryptocurrencies: The volatile nature of cryptocurrencies means they can have pronounced trends. The Supertrend Advance Strategy can aid crypto traders in navigating these often tumultuous waters.
5. Futures & Options: Traders and investors in derivative markets can utilize the strategy to make more informed decisions about contract entries and exits.
It's important to note that while the Supertrend Advance Strategy can be applied across various assets and markets, its effectiveness might vary based on market conditions, timeframe, and the specific characteristics of the asset in question. As always, it's recommended to use the strategy in conjunction with other analytical tools and to backtest its effectiveness in specific scenarios before committing to trades.
4. Input Settings
Understanding and correctly configuring input settings is crucial for optimizing the Supertrend Advance Strategy for any specific market or asset. These settings, when tweaked correctly, can drastically impact the strategy's performance.
Grouping Inputs:
Before diving into individual input settings, it's important to group similar inputs. Grouping can simplify the user interface, making it easier to adjust settings related to a specific function or indicator.
Strategy Choice:
This input allows traders to select from various strategies that incorporate the Supertrend indicator. Options might include "Supertrend with RSI," "Supertrend with MACD," etc. By choosing a strategy, the associated input settings for that strategy become available.
Supertrend Settings:
1. Multiplier: Typically, a default value of 3 is used. This multiplier is used in the ATR calculation. Increasing it makes the Supertrend line further from prices, while decreasing it brings the line closer.
2. Period: The number of bars used in the ATR calculation. A common default is 7.
EMA Settings (Exponential Moving Average):
1. Period: Defines the number of previous bars used to calculate the EMA. Common periods are 9, 21, 50, and 200.
2. Source: Allows traders to choose which price (Open, Close, High, Low) to use in the EMA calculation.
RSI Settings (Relative Strength Index):
1. Length: Determines how many periods are used for RSI calculation. The standard setting is 14.
2. Overbought Level: The threshold at which the asset is considered overbought, typically set at 70.
3. Oversold Level: The threshold at which the asset is considered oversold, often at 30.
MACD Settings (Moving Average Convergence Divergence):
1. Short Period: The shorter EMA, usually set to 12.
2. Long Period: The longer EMA, commonly set to 26.
3. Signal Period: Defines the EMA of the MACD line, typically set at 9.
CCI Settings (Commodity Channel Index):
1. Period: The number of bars used in the CCI calculation, often set to 20.
2. Overbought Level: Typically set at +100, denoting overbought conditions.
3. Oversold Level: Usually set at -100, indicating oversold conditions.
SL/TP Settings (Stop Loss/Take Profit):
1. SL Multiplier: Defines the multiplier for the average true range (ATR) to set the stop loss.
2. TP Multiplier: Defines the multiplier for the average true range (ATR) to set the take profit.
Filtering Conditions:
This section allows traders to set conditions to filter out certain signals. For example, one might only want to take buy signals when the RSI is below 30, ensuring they buy during oversold conditions.
Trade Direction and Backtest Period:
1. Trade Direction: Allows traders to specify whether they want to take long trades, short trades, or both.
2. Backtest Period: Specifies the time range for backtesting the strategy. Traders can choose from options like 'Last 6 months,' 'Last 1 year,' etc.
It's essential to remember that while default settings are provided for many of these tools, optimal settings can vary based on the market, timeframe, and trading style. Always backtest new settings on historical data to gauge their potential efficacy.
5. Understanding Strategy Conditions
Developing an understanding of the conditions set within a trading strategy is essential for traders to maximize its potential. Here, we delve deep into the logic behind these conditions, using the Supertrend Advance Strategy as our focal point.
Basic Logic Behind Conditions:
Every strategy is built around a set of conditions that provide buy or sell signals. The conditions are based on mathematical or statistical methods and are rooted in the study of historical price data. The fundamental idea is to recognize patterns or behaviors that have been profitable in the past and might be profitable in the future.
Buy and Sell Conditions:
1. Buy Conditions: Usually formulated around bullish signals or indicators suggesting upward price momentum.
2. Sell Conditions: Centered on bearish signals or indicators indicating downward price momentum.
Simple Strategy:
The simple strategy could involve using just the Supertrend indicator. Here:
• Buy: When price closes above the Supertrend line.
• Sell: When price closes below the Supertrend line.
Pullback Strategy:
This strategy capitalizes on price retracements:
• Buy: When the price retraces to the Supertrend line after a bullish signal and is supported by another bullish indicator.
• Sell: When the price retraces to the Supertrend line after a bearish signal and is confirmed by another bearish indicator.
Indicators Used:
EMA (Exponential Moving Average):
• Logic: EMA gives more weight to recent prices, making it more responsive to current price movements. A shorter-period EMA crossing above a longer-period EMA can be a bullish sign, while the opposite is bearish.
RSI (Relative Strength Index):
• Logic: RSI measures the magnitude of recent price changes to analyze overbought or oversold conditions. Values above 70 are typically considered overbought, and values below 30 are considered oversold.
MACD (Moving Average Convergence Divergence):
• Logic: MACD assesses the relationship between two EMAs of a security’s price. The MACD line crossing above the signal line can be a bullish signal, while crossing below can be bearish.
CCI (Commodity Channel Index):
• Logic: CCI compares a security's average price change with its average price variation. A CCI value above +100 may mean the price is overbought, while below -100 might signify an oversold condition.
And others...
As the strategy expands or contracts, more indicators might be added or removed. The crucial point is to understand the core logic behind each, ensuring they align with the strategy's objectives.
Logic Behind Each Indicator:
1. EMA: Emphasizes recent price movements; provides dynamic support and resistance levels.
2. RSI: Indicates overbought and oversold conditions based on recent price changes.
3. MACD: Showcases momentum and direction of a trend by comparing two EMAs.
4. CCI: Measures the difference between a security's price change and its average price change.
Understanding strategy conditions is not just about knowing when to buy or sell but also about comprehending the underlying market dynamics that those conditions represent. As you familiarize yourself with each condition and indicator, you'll be better prepared to adapt and evolve with the ever-changing financial markets.
6. Trade Execution and Management
Trade execution and management are crucial aspects of any trading strategy. Efficient execution can significantly impact profitability, while effective management can preserve capital during adverse market conditions. In this section, we'll explore the nuances of position entry, exit strategies, and various Stop Loss (SL) and Take Profit (TP) methodologies within the Supertrend Advance Strategy.
Position Entry:
Effective trade entry revolves around:
1. Timing: Enter at a point where the risk-reward ratio is favorable. This often corresponds to confirmatory signals from multiple indicators.
2. Volume Analysis: Ensure there's adequate volume to support the movement. Volume can validate the strength of a signal.
3. Confirmation: Use multiple indicators or chart patterns to confirm the entry point. For instance, a buy signal from the Supertrend indicator can be confirmed with a bullish MACD crossover.
Position Exit Strategies:
A successful exit strategy will lock in profits and minimize losses. Here are some strategies:
1. Fixed Time Exit: Exiting after a predetermined period.
2. Percentage-based Profit Target: Exiting after a certain percentage gain.
3. Indicator-based Exit: Exiting when an indicator gives an opposing signal.
Percentage-based SL/TP:
• Stop Loss (SL): Set a fixed percentage below the entry price to limit potential losses.
• Example: A 2% SL on an entry at $100 would trigger a sell at $98.
• Take Profit (TP): Set a fixed percentage above the entry price to lock in gains.
• Example: A 5% TP on an entry at $100 would trigger a sell at $105.
Supertrend-based SL/TP:
• Stop Loss (SL): Position the SL at the Supertrend line. If the price breaches this line, it could indicate a trend reversal.
• Take Profit (TP): One could set the TP at a point where the Supertrend line flattens or turns, indicating a possible slowdown in momentum.
Swing high/low-based SL/TP:
• Stop Loss (SL): For a long position, set the SL just below the recent swing low. For a short position, set it just above the recent swing high.
• Take Profit (TP): For a long position, set the TP near a recent swing high or resistance. For a short position, near a swing low or support.
And other methods...
1. Trailing Stop Loss: This dynamic SL adjusts with the price movement, locking in profits as the trade moves in your favor.
2. Multiple Take Profits: Divide the position into segments and set multiple TP levels, securing profits in stages.
3. Opposite Signal Exit: Exit when another reliable indicator gives an opposite signal.
Trade execution and management are as much an art as they are a science. They require a blend of analytical skill, discipline, and intuition. Regularly reviewing and refining your strategies, especially in light of changing market conditions, is crucial to maintaining consistent trading performance.
7. Visual Representations
Visual tools are essential for traders, as they simplify complex data into an easily interpretable format. Properly analyzing and understanding the plots on a chart can provide actionable insights and a more intuitive grasp of market conditions. In this section, we’ll delve into various visual representations used in the Supertrend Advance Strategy and their significance.
Understanding Plots on the Chart:
Charts are the primary visual aids for traders. The arrangement of data points, lines, and colors on them tell a story about the market's past, present, and potential future moves.
1. Data Points: These represent individual price actions over a specific timeframe. For instance, a daily chart will have data points showing the opening, closing, high, and low prices for each day.
2. Colors: Used to indicate the nature of price movement. Commonly, green is used for bullish (upward) moves and red for bearish (downward) moves.
Trend Lines:
Trend lines are straight lines drawn on a chart that connect a series of price points. Their significance:
1. Uptrend Line: Drawn along the lows, representing support. A break below might indicate a trend reversal.
2. Downtrend Line: Drawn along the highs, indicating resistance. A break above might suggest the start of a bullish trend.
Filled Areas:
These represent a range between two values on a chart, usually shaded or colored. For instance:
1. Bollinger Bands: The area between the upper and lower band is filled, giving a visual representation of volatility.
2. Volume Profile: Can show a filled area representing the amount of trading activity at different price levels.
Stop Loss and Take Profit Lines:
These are horizontal lines representing pre-determined exit points for trades.
1. Stop Loss Line: Indicates the level at which a trade will be automatically closed to limit losses. Positioned according to the trader's risk tolerance.
2. Take Profit Line: Denotes the target level to lock in profits. Set according to potential resistance (for long trades) or support (for short trades) or other technical factors.
Trailing Stop Lines:
A trailing stop is a dynamic form of stop loss that moves with the price. On a chart:
1. For Long Trades: Starts below the entry price and moves up with the price but remains static if the price falls, ensuring profits are locked in.
2. For Short Trades: Starts above the entry price and moves down with the price but remains static if the price rises.
Visual representations offer traders a clear, organized view of market dynamics. Familiarity with these tools ensures that traders can quickly and accurately interpret chart data, leading to more informed decision-making. Always ensure that the visual aids used resonate with your trading style and strategy for the best results.
8. Backtesting
Backtesting is a fundamental process in strategy development, enabling traders to evaluate the efficacy of their strategy using historical data. It provides a snapshot of how the strategy would have performed in past market conditions, offering insights into its potential strengths and vulnerabilities. In this section, we'll explore the intricacies of setting up and analyzing backtest results and the caveats one must be aware of.
Setting Up Backtest Period:
1. Duration: Determine the timeframe for the backtest. It should be long enough to capture various market conditions (bullish, bearish, sideways). For instance, if you're testing a daily strategy, consider a period of several years.
2. Data Quality: Ensure the data source is reliable, offering high-resolution and clean data. This is vital to get accurate backtest results.
3. Segmentation: Instead of a continuous period, sometimes it's helpful to backtest over distinct market phases, like a particular bear or bull market, to see how the strategy holds up in different environments.
Analyzing Backtest Results:
1. Performance Metrics: Examine metrics like the total return, annualized return, maximum drawdown, Sharpe ratio, and others to gauge the strategy's efficiency.
2. Win Rate: It's the ratio of winning trades to total trades. A high win rate doesn't always signify a good strategy; it should be evaluated in conjunction with other metrics.
3. Risk/Reward: Understand the average profit versus the average loss per trade. A strategy might have a low win rate but still be profitable if the average gain far exceeds the average loss.
4. Drawdown Analysis: Review the periods of losses the strategy could incur and how long it takes, on average, to recover.
9. Tips and Best Practices
Successful trading requires more than just knowing how a strategy works. It necessitates an understanding of when to apply it, how to adjust it to varying market conditions, and the wisdom to recognize and avoid common pitfalls. This section offers insightful tips and best practices to enhance the application of the Supertrend Advance Strategy.
When to Use the Strategy:
1. Market Conditions: Ideally, employ the Supertrend Advance Strategy during trending market conditions. This strategy thrives when there are clear upward or downward trends. It might be less effective during consolidative or sideways markets.
2. News Events: Be cautious around significant news events, as they can cause extreme volatility. It might be wise to avoid trading immediately before and after high-impact news.
3. Liquidity: Ensure you are trading in assets/markets with sufficient liquidity. High liquidity ensures that the price movements are more reflective of genuine market sentiment and not due to thin volume.
Adjusting Settings for Different Markets/Timeframes:
1. Markets: Each market (stocks, forex, commodities) has its own characteristics. It's essential to adjust the strategy's parameters to align with the market's volatility and liquidity.
2. Timeframes: Shorter timeframes (like 1-minute or 5-minute charts) tend to have more noise. You might need to adjust the settings to filter out false signals. Conversely, for longer timeframes (like daily or weekly charts), you might need to be more responsive to genuine trend changes.
3. Customization: Regularly review and tweak the strategy's settings. Periodic adjustments can ensure the strategy remains optimized for the current market conditions.
10. Frequently Asked Questions (FAQs)
Given the complexities and nuances of the Supertrend Advance Strategy, it's only natural for traders, both new and seasoned, to have questions. This section addresses some of the most commonly asked questions regarding the strategy.
1. What exactly is the Supertrend Advance Strategy?
The Supertrend Advance Strategy is an evolved version of the traditional Supertrend indicator. It's designed to provide clearer buy and sell signals by incorporating additional indicators like EMA, RSI, MACD, CCI, etc. The strategy aims to capitalize on market trends while minimizing false signals.
2. Can I use the Supertrend Advance Strategy for all asset types?
Yes, the strategy can be applied to various asset types like stocks, forex, commodities, and cryptocurrencies. However, it's crucial to adjust the settings accordingly to suit the specific characteristics and volatility of each asset type.
3. Is this strategy suitable for day trading?
Absolutely! The Supertrend Advance Strategy can be adjusted to suit various timeframes, making it versatile for both day trading and long-term trading. Remember to fine-tune the settings to align with the timeframe you're trading on.
4. How do I deal with false signals?
No strategy is immune to false signals. However, by combining the Supertrend with other indicators and adhering to strict risk management protocols, you can minimize the impact of false signals. Always use stop-loss orders and consider filtering trades with additional confirmation signals.
5. Do I need any prior trading experience to use this strategy?
While the Supertrend Advance Strategy is designed to be user-friendly, having a foundational understanding of trading and market analysis can greatly enhance your ability to employ the strategy effectively. If you're a beginner, consider pairing the strategy with further education and practice on demo accounts.
6. How often should I review and adjust the strategy settings?
There's no one-size-fits-all answer. Some traders adjust settings weekly, while others might do it monthly. The key is to remain responsive to changing market conditions. Regular backtesting can give insights into potential required adjustments.
7. Can the Supertrend Advance Strategy be automated?
Yes, many traders use algorithmic trading platforms to automate their strategies, including the Supertrend Advance Strategy. However, always monitor automated systems regularly to ensure they're operating as intended.
8. Are there any markets or conditions where the strategy shouldn't be used?
The strategy might generate more false signals in markets that are consolidative or range-bound. During significant news events or times of unexpected high volatility, it's advisable to tread with caution or stay out of the market.
9. How important is backtesting with this strategy?
Backtesting is crucial as it allows traders to understand how the strategy would have performed in the past, offering insights into potential profitability and areas of improvement. Always backtest any new setting or tweak before applying it to live trades.
10. What if the strategy isn't working for me?
No strategy guarantees consistent profits. If it's not working for you, consider reviewing your settings, seeking expert advice, or complementing the Supertrend Advance Strategy with other analysis methods. Remember, continuous learning and adaptation are the keys to trading success.
Other comments
Value of combining several indicators in this script and how they work together
Diversification of Signals: Just as diversifying an investment portfolio can reduce risk, using multiple indicators can offer varied perspectives on potential price movements. Each indicator can capture a different facet of the market, ensuring that traders are not overly reliant on a single data point.
Confirmation & Reduced False Signals: A common challenge with many indicators is the potential for false signals. By requiring confirmation from multiple indicators before acting, the chances of acting on a false signal can be significantly reduced.
Flexibility Across Market Conditions: Different indicators might perform better under different market conditions. For example, while moving averages might excel in trending markets, oscillators like RSI might be more useful during sideways or range-bound conditions. A mashup strategy can potentially adapt better to varying market scenarios.
Comprehensive Analysis: With multiple indicators, traders can gauge trend strength, momentum, volatility, and potential market reversals all at once, providing a holistic view of the market.
How do the different indicators in the Supertrend Advance Strategy work together?
Supertrend: This is primarily a trend-following indicator. It provides traders with buy and sell signals based on the volatility of the price. When combined with other indicators, it can filter out noise and give more weight to strong, confirmed trends.
EMA (Exponential Moving Average): EMA gives more weight to recent price data. It can be used to identify the direction and strength of a trend. When the price is above the EMA, it's generally considered bullish, and vice versa.
RSI (Relative Strength Index): An oscillator that measures the magnitude of recent price changes to evaluate overbought or oversold conditions. By cross-referencing with other indicators like EMA or MACD, traders can spot potential reversals or confirmations of a trend.
MACD (Moving Average Convergence Divergence): This indicator identifies changes in the strength, direction, momentum, and duration of a trend in a stock's price. When the MACD line crosses above the signal line, it can be a bullish sign, and when it crosses below, it can be bearish. Pairing MACD with Supertrend can provide dual confirmation of a trend.
CCI (Commodity Channel Index): Initially developed for commodities, CCI can indicate overbought or oversold conditions. It can be used in conjunction with other indicators to determine entry and exit points.
In essence, the synergy of these indicators provides a balanced, comprehensive approach to trading. Each indicator offers its unique lens into market conditions, and when they align, it can be a powerful indication of a trading opportunity. This combination not only reduces the potential drawbacks of each individual indicator but leverages their strengths, aiming for more consistent and informed trading decisions.
Backtesting and Default Settings
• This indicator has been optimized to be applied for 1 hour-charts. However, the underlying principles of this strategy are supply and demand in the financial markets and the strategy can be applied to all timeframes. Daytraders can use the 1min- or 5min charts, swing-traders can use the daily charts.
• This strategy has been designed to identify the most promising, highest probability entries and trades for each stock or other financial security.
• The combination of the qualifiers results in a highly selective strategy which only considers the most promising swing-trading entries. As a result, you will normally only find a low number of trades for each stock or other financial security per year in case you apply this strategy for the daily charts. Shorter timeframes will result in a higher number of trades / year.
• Consequently, traders need to apply this strategy for a full watchlist rather than just one financial security.
• Default properties: RSI on (length 14, RSI buy level 50, sell level 50), EMA, RSI, MACD on, type of strategy pullback, SL/TP type: ATR (length 10, factor 3), trade direction both, quantity 5, take profit swing hl 5.1, highest / lowest lookback 2, enable ATR trail (ATR length 10, SL ATR multiplier 1.4, TP multiplier 2.1, lookback = 4, trade direction = both).

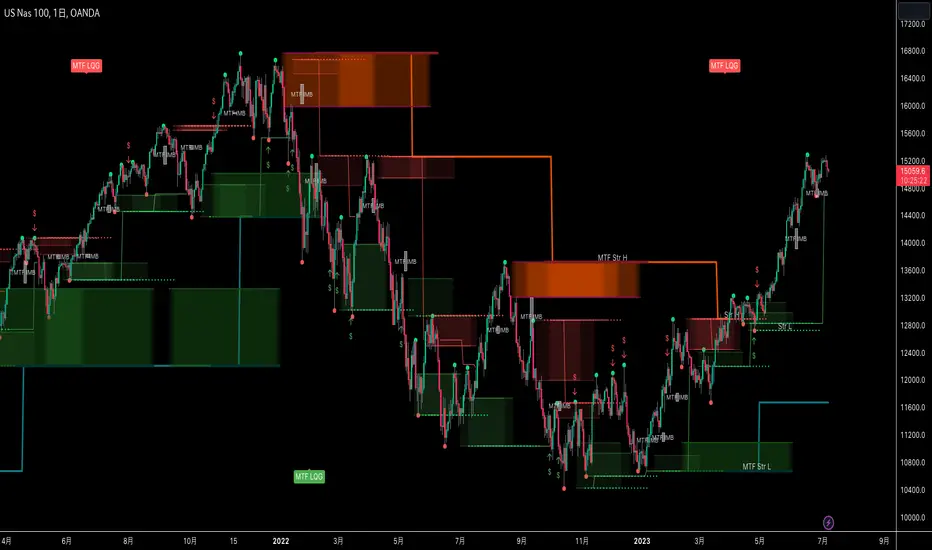
MTF Smart Money ConceptsOverview
This indicator displays major elements of Smart Money Concepts and price action trading with multi-timeframes(MTF) and layered market structures with color visualization.
What is Smart Money Concepts?
Smart Money Concepts(SMC) is one of the methodologies to interpret how financial market moves and to analyze it and execute trades, focusing on liquidity and order flow of financial institutions.
Smart money means the funds invested by large financial institutions such as banks, institutional traders/investors, market makers, hedge funds etc. contrary to retail traders/investors' money.
It is important to note that there is no proof or evidence that those institutions move the market as described in Smart Money Concepts.
Personally speaking, it is one of the interpretation of the market and another angle to view the market just like other technical analysis methodologies such as Elliott Wave Principle, Gann Theory, Wyckoff Method and even traditional price action trading.
Importance of MTF Analysis
MTF analysis(a.k.a Topdown analysis) is the foundation to technically analyze charts and the most fundamental skill in trading because lower timeframes are always influenced by upper timeframes where large financial institutions operate.
How to use
This indicator is designed to help traders analyze how the market moves in terms of SMC and price action with multi-timeframes and color visualization of the market structures, which makes this indicator unique and different from other indicators.
There is two key settings that you can use based on your trading style.
1.Upper timeframe selection
You have two options to determine upper timeframe; Auto mode and Manual mode.
When Auto mode selected, upper timeframe will be determined based on chart timeframe as follows.
Chart timeframe => Upper timeframe
1M=>15M
5M/15M=>1H
30M/1H=>4H
4H=>D
D=>W
W=>M
If you select Manual mode, you can fix an upper timeframe.
2.High/low settings
This affects all other settings of the indicator and most importantly designs the market structure.
This is the key setting to determine how you view the market as price action trading is all about highs and lows and story of how highs and lows have been created with the market structure.
You can specify left bars and right bars to identify swing highs/lows and these highs/lows become the basis to design the market structure and determine how SMC elements are displayed.
Example:
Left bar&right bar: 10
You can see bigger wave(magenta line) in the market structure(stepped line).
(Magenta line is a drawn object by manual)
Left bar&right bar: 4
With this setting, you can see smaller wave in the market structure.
Since market moves like wave as there is a lot of wave theories in financial investment/trading industry such as Elliott wave, Wolf wave etc., users can define market structure with this setting depending on what degree of wave they aim to trade.
Functions:
MTF Order Block
Concept
Order block is a block of orders where buying orders and selling orders are accumulated. Order blocks are created when the institutions move the market up and down, temporality placing orders in an opposite direction to the way they want to move, in order to match their own orders with counter-orders.
Visualization by the indicator
The indicator displays both chart timeframe's order blocks and upper timeframe's order blocks(MTF).
You can also select from two options how to display order blocks;
1. Show all order blocks
2. Show strong order blocks only
Note: Strong order blocks mean order blocks created at strong highs/lows. See also strong high/low below.
Alerts can be set when prices reach strong order blocks.
MTF Fair Value Gap(FVG)/Imbalance
Concept
Fair Value Gap(FVG)(Imbalance) is a void generated among three consecutive candlesticks.
FVG(s) is created when the market moves so rapidly generating buy side or sell side order imbalances.
FVG(s) is characterized by price action that prices tend to come back to the area where FVG(s) exists, filling in the space among the candlesticks.
Visualization by the indicator
The indicator displays both chart timeframe's FVG and upper timeframe's FVG.
MTF Liquidity Grab
Concept
Liquidity grab is price action to sweep liquidity for the institutions to move the market.
This price action often happens because the size of their orders is so huge and they need a bunch of counter-orders to match their orders. This is why prices sometimes come to areas where liquidity rest and swipe them before the market goes up/down.
Liquidity visualization
Where does liquidity rest?
The answer is above highs(buy side liquidity) and below lows(sell side liquidity).
Among all highs and lows, swing highs and lows are where liquidity is accumulated the most because swing highs and lows can be created only by the institutions, therefore massive liquidity is indicated.
Visualization by the indicator
The indicator displays liquidity dots so that users can easily identify where liquidity rests and liquidity grab of both a chart timeframe and an upper timeframe.
Alerts can be set when liquidity grab happens.
MTF Strong High/Low
Concept
Strong high/low literally means strong highs and lows among all highs and lows including swing highs and lows.
There is a few different definitions of strong high/low in price action trading and the definition in this indicator is as follows.
Strong high
A high that that breaks higher low or lower low
Strong low
A low that breaks lower high or higher high
Visualization by the indicator
The indicator displays strong highs and lows of both a chart timeframe and an upper timeframe.
MTF Market Structure Visualization
Concept
Market structure is a series of price movement with highs and lows which outlines the way the market directs. It is a basis to see trend occurrence, trend reversal and sideways and analyzing the market structures in multi-timeframes is the most fundamental technical skill in trading/investment.
Visualization by the indicator
The indicator displays market structures of both a chart timeframe and an upper timeframe and provide color visualization depending on bullish and bearish market structures.
The definition of bullish and bearish market structure is as follows.
Bullish market structure
When a price breaks a Lower High or Higher High
Bearish market structure
When a price breaks a Higher Low or Lower Low
Settings
All the functions above, colors and line settings are parameterized and can be turned on/off depending on users’ needs.
———————————————————————————
概要
Smart Money Concepts(SMC)およびプライスアクショントレードにおける重要な要素をマルチタイムフレームで表示することのできるインジケーターです。
相場構造(Market structure)をマルチタイムフレームで表示し、相場構造の強弱を色で可視化することができます。
Smart Money Concepts(スマートマネーコンセプト)とは?
Smart Money Concepts(以下SMC) は金融市場がどのように動くかを解釈し、分析し、取引を執行するための相場理論の一つであり、Liquidity(リクイディティ)および機関投資家のオーダーフロー(注文の流れ)に焦点を置いていることが特徴です。
Smart Money(スマートマネー)とは、銀行や機関投資家、マーケットメーカー、ヘッジファンドといった金融機関が動かす資金を意味し、個人投資家の資金と対をなす概念です。
重要な点は、実際に上記の金融機関がSmart Money Conceptsで語られているような相場の動かし方をしているかどうかを証明する明確なエビデンスはないということです。
個人的には、エリオット波動理論やギャン理論、ワイコフ理論、伝統的なプライスアクショントレーディングの方法論と同様に、マーケットの動きを解釈するための一つの方法論であり、マーケットの動きを別の角度から見る枠組みと捉えています。
マルチタイムフレーム(MTF)分析の重要性
MTF分析はチャートをテクニカルに分析する上での基礎であり、トレードにおいて最も重要なスキルです。なぜなら下位のタイムフレームは上記のような金融機関が資金運用を行う上位のタイムフレームの影響を常に受けるためです。
使い方
このインジケーターは、SMCまたはプライスアクショントレードの観点から、トレーダーがマーケットをマルチタイムフレームで分析することを支援するために開発しています。
相場構造(Market structure/マーケットストラクチャー)を方向性に応じて色で可視化することができるため、視覚的に相場の構造を判断できることがこのインジケータのユニークな点であり、他のインジケーターと異なる点です。
ユーザーのトレードスタイルに応じて、以下の二つの設定を行うことができます。
1.上位足の決定方法
ユーザーは上位足のタイムフレームを決定するにあたり、AutoモードとManualモードを選択することができます。
Autoモードを選択した場合、上位足はチャートのタイムフレームに応じて以下のように決定されます。
チャートタイムフレーム => 上位足タイムフレーム
1M=>15M
5M/15M=>1H
30M/1H=>4H
4H=>D
D=>W
W=>M
Manualモードを選択すると上位足のタイムフレームを固定することができます。
2.High/low(高値/安値) 設定
当設定はインジケーターの他の全ての機能に影響し、また最も重要である相場構造の定義に影響します。
当設定はユーザーがマーケットをどのように見るか(=どの程度の粒度)を決定する重要な設定です。なぜならプライスアクショントレードは、高値、安値とそれらが相場構造をどのように構築してきたかの一連の流れを分析することが全てだからです。
ユーザーは相場構造を決定付けるスイングハイ·スイングローを特定するためのバーの本数を設定することができます。ここで設定した内容が、相場構造を定義し、以下で説明するSMCの要素の表示を決定することになります。
例:
Left bar&right bar(左右のバーの数): 10
この場合、ステップラインで示した相場構造の中に大きな波(マゼンタの波)を見ることができます。
(マゼンタのラインは手動で描いたオブジェクト)
Left bar&right bar: 4
この設定では、上記に比べて小さい波を描いていることが確認できます。
相場理論の中にエリオット波動理論やウォルフ波動といった数多くの波動理論があることからわかるように、相場は波として動きます。どの粒度の波を狙うかというトレーダーのスタイルに応じて、設定を変更することができます。
機能
MTFオーダーブロック
コンセプト
オーダーブロックとは買い注文と売り注文が一連となって蓄積されたオーダー(注文)のブロックのことです。
オーダーブロックは機関投資家が相場を動かす際に、本来意図する方向とは一時的に逆に動かすことで、彼ら自身の注文をマッチングさせるための反対注文を発生させることで形成されます。
インジケーターによる表示
インジケーターはチャートタイムフレームのオーダーブロックと上位足のオーダーブロックの両方を表示することができます。
また、オーダーブロックの表示オプションとして、
1.全てのオーダーブロックを表示
2.Strong(ストロング)オーダーブロックのみを表示
を選択することが可能です。
注: StrongオーダーブロックはStrong High/Lowで形成されるオーダーブロックを指します。(下記参照)
また、オーダーブロック到達でのアラート設定も可能です。
MTFフェアーバリューギャップ(FVG)/インバランス
コンセプト
フェアーバリューギャップ(FVG)/インバランスとは連続する3つのローソク足の間に形成される溝(Gap)のことです。
フェアーバリューギャップはマーケットが非常に早く動いたことにより、買いオーダーと売りオーダーの需給バランスが崩れることによって発生します。
フェアーバリューギャップには、価格がフェアーバリューギャップが発生したエリアまで戻ってくる傾向があるという特徴が存在します。
インジケーターによる表示
インジケーターはチャートタイムフレームのフェアーバリューギャップと上位足のフェアーバリューギャップの両方を表示することができます。
MTF Liquidity Grab(リクイディティ·グラブ)
コンセプト
Liquidity(リクイディティ)とはマネー、つまり注文です。
Liquidity Grab(リクイディティ·グラブ)とは、機関投資家がマーケットを動かす際にLiquidityを取得するプライスアクションのことを指します。
このプライスアクションは、機関投資家が処理する注文サイズが非常に大きいため、自身の注文を出す際に大量の反対注文を必要とすることからしばしば発生します。
これが、価格がLiquidity(注文)の集まっているエリアに接近し、それら注文をスワイプ(狩り取る)した後に上昇·下落する理由です。
Liquidityの可視化
一般的にLiquidityは高値の上(buy side liquidity)、安値の下(sell side liquidity)に存在します。
全ての高値·安値の中で、スイングハイ·ローがliquidityが最も蓄積されているエリアということができます。なぜならスイングハイ·ローは機関投資家の注文によってのみ形成されるからです。
インジケーターによる表示
ユーザーがLiquidityポイントを簡単に識別できるようにLiquidityをドット表示することが可能です。またチャートタイムフレームと上位足の両方のLiquidity Grabを表示することができます。
Liquidity Grab発生時にアラートも設定可能です。
MTF Strong High/Low(ストロングハイ·ロー)
コンセプト
Strong high/lowは文字通り、強い高値·安値のことを指します。
トレーダーの間でいくつかの異なる定義が存在しますが、当インジケーターでの定義は以下の通りです。
Strong high
Higher low(ハイアーロー) または Lower low(ロワーロー)をブレイクした高値
Strong low
Lower higher (ロワーハイ) または Higher High(ハイアーハイ)をブレイクした安値
インジケーターによる表示
チャートタイムフレーム、上位足のStrong High/Lowを表示することが可能です。
相場構造可視化
コンセプト
相場構造(Market structure/マーケットストラクチャー)とは、相場の流れを成り立たせる高値と安値を元にした一連の値動きです。建物における骨組みに該当します。
トレンドの発生、転換、レンジを見極めるための基礎であり、マルチタイムフレームで相場構造を分析することは、投資·トレードにおいて最も重要なテクニカルスキルです。
インジケーターによる表示
チャートタイムフレームと上位足タイムフレーム両方の相場構造を表示することができます。
また、相場構造が強気の状態か弱気の状態かを色で可視化するため、上位足含めた相場の流れを視覚的に判断することが可能です。
相場構造の強弱の定義は以下の通りです。
強気の相場構造(Bullish market structure)
価格がLower HighまたはHigher Highをブレイクしたとき
弱気の相場構造(Bearish market structure)
価格がHigher LowまたはLower Lowをブレイクしたとき
設定
上記の全ての機能は色やライン設定含めパラメーターで設定が可能です。またユーザの必要に応じて表示·非表示を切り替えることができます。
RSI Signals Multi-Layer RSI System with Classical Divergence**DrFX RSI Signals Fixed** is an advanced RSI-based trading system that combines duration-filtered extreme conditions with classical divergence detection and momentum confirmation. This enhanced version addresses common RSI false signals through multi-layer filtering while adding proper divergence analysis for identifying high-probability reversal points.
**Core Innovation & Originality**
This indicator uniquely integrates five analytical layers:
1. **Duration-Validated Extreme Zones** - Confirms RSI has remained overbought/oversold for minimum bars within lookback period
2. **Classical Divergence Detection** - Proper implementation comparing swing highs/lows in both price and RSI
3. **Momentum Confirmation Signals** - RSI crossing 50-line after extreme conditions for trend confirmation
4. **Multi-Signal Classification** - Four distinct signal types (Buy, Sell, Strong Buy, Strong Sell, Momentum)
5. **Visual Zone Highlighting** - Background coloring for instant extreme zone identification
**Technical Implementation & Improvements**
**Enhanced Duration Filter:**
Unlike the previous version, this system uses a refined approach:
```
for i = 0 to lookback_bars - 1
if rsi > overbought
barsInOverbought := barsInOverbought + 1
```
This counts actual bars within the lookback period (default 20 bars) where RSI was extreme, requiring minimum duration (default 4 bars) for signal validation.
**Classical Divergence Detection:**
The system implements proper divergence analysis, a significant improvement over simple delta comparison:
**Bullish Divergence Logic:**
- Price makes lower low: `low < prevPriceLow`
- RSI makes higher low: `rsi > prevRsiLow`
- Indicates weakening downward momentum despite lower prices
**Bearish Divergence Logic:**
- Price makes higher high: `high > prevPriceHigh`
- RSI makes lower high: `rsi < prevRsiHigh`
- Indicates weakening upward momentum despite higher prices
**Signal Generation Framework:**
**Primary Signals:**
- **Buy Signal**: RSI crosses above oversold (30) after meeting duration requirements
- **Sell Signal**: RSI crosses below overbought (70) after meeting duration requirements
**Strong Signals:**
- **Strong Buy**: Buy signal + bullish divergence confirmation
- **Strong Sell**: Sell signal + bearish divergence confirmation
**Momentum Signals:**
- **Momentum Buy (M+)**: RSI crosses above 50 after recent oversold conditions
- **Momentum Sell (M-)**: RSI crosses below 50 after recent overbought conditions
**What Makes This Version Superior**
**Compared to Standard RSI:**
1. **Duration Requirement**: Prevents signals on brief RSI spikes
2. **Lookback Validation**: Ensures extreme conditions actually occurred recently
3. **Proper Divergence**: Uses swing high/low comparison, not just bar-to-bar deltas
4. **Momentum Layer**: Adds trend confirmation via 50-line crosses
**Compared to Previous Version:**
1. **Pine Script v5**: Modern syntax with improved performance
2. **Configurable Parameters**: All values adjustable via inputs
3. **Better Divergence**: Classical divergence logic replaces simplified delta method
4. **Additional Signals**: Momentum confirmations for trend following
5. **Visual Enhancements**: Background coloring and improved signal differentiation
6. **Alert System**: Built-in alert conditions for all signal types
**Parameter Configuration**
**Customizable Inputs:**
- **Overbought Level** (70): Upper threshold, range 50-90
- **Oversold Level** (30): Lower threshold, range 10-50
- **RSI Period** (14): Calculation period, range 2-50
- **Minimum Duration** (4): Required bars in extreme zone, range 1-20
- **Lookback Bars** (20): Period to check for extreme conditions, range 5-100
- **Divergence Lookback** (5): Period for divergence swing comparison, range 2-20
**Optimization Guidelines:**
- **Shorter Duration** (2-3): More frequent signals, higher noise
- **Longer Duration** (5-7): Fewer signals, better quality
- **Smaller Lookback** (10-15): Faster response, may miss context
- **Larger Lookback** (30-50): More context, potentially delayed signals
**Signal Interpretation Guide**
**Visual Signal Hierarchy:**
**Light Green Triangle (Buy):**
- RSI recovered from oversold
- Duration requirements met
- Entry on reversal from oversold territory
**Light Red Triangle (Sell):**
- RSI declined from overbought
- Duration requirements met
- Entry on reversal from overbought territory
**Blue Triangle (Strong Buy):**
- Buy signal with bullish divergence
- Highest probability long setup
- Price made lower low, RSI made higher low
**Magenta Triangle (Strong Sell):**
- Sell signal with bearish divergence
- Highest probability short setup
- Price made higher high, RSI made lower high
**Tiny Green Circle (M+):**
- RSI crossed above 50 after oversold
- Momentum confirmation for uptrend
- Secondary entry or trend confirmation
**Tiny Red Circle (M-):**
- RSI crossed below 50 after overbought
- Momentum confirmation for downtrend
- Secondary entry or trend confirmation
**Background Coloring:**
- **Light Red Background**: RSI > 70 (overbought zone)
- **Light Green Background**: RSI < 30 (oversold zone)
**Trading Strategy Application**
**Conservative Approach (Strong Signals Only):**
1. Wait for blue/magenta triangles (divergence confirmed)
2. Enter on signal bar close or next bar open
3. Stop loss beyond recent swing high/low
4. Target minimum 2:1 risk/reward ratio
**Aggressive Approach (All Signals):**
1. Take light green/red triangles for earlier entries
2. Use momentum circles as confirmation
3. Tighter stops with partial profit taking
4. Scale positions based on signal strength
**Momentum Trading:**
1. Use momentum signals (M+/M-) as trend filters
2. Take primary signals aligned with momentum direction
3. Avoid counter-momentum signals in strong trends
4. Exit when opposing momentum signal appears
**Multi-Timeframe Strategy:**
1. Check higher timeframe for strong signals
2. Execute on lower timeframe primary signals
3. Use momentum signals for position management
4. Align all timeframe signals for best probability
**Optimal Market Conditions**
**Best Performance:**
- Mean-reverting markets with clear RSI extremes
- Range-bound or consolidating conditions
- Markets respecting support/resistance levels
- Timeframes: 15min to 4H for active trading
**Strong Signal Advantages:**
- Divergence signals often mark major turning points
- Work well at market structure levels
- Effective in both trending and ranging markets
- Higher success rate justifies waiting for setup
**Momentum Signal Benefits:**
- Confirms trend direction after extreme readings
- Useful for adding to positions
- Helps avoid counter-trend trades
- Works well in trending markets where reversals fail
**Technical Advantages**
**Divergence Accuracy:**
The improved divergence detection uses proper swing analysis rather than simple bar-to-bar comparison. This identifies genuine momentum shifts where price action diverges from oscillator movement over a meaningful period.
**Duration Logic:**
The for-loop counting method ensures the system checks actual RSI values within the lookback period, not just whether RSI touched levels. This distinguishes between sustained conditions and brief spikes.
**Momentum Filter:**
The 50-line crosses after extreme conditions provide an additional confirmation layer, helping traders distinguish between failed reversals (no momentum follow-through) and sustained moves (momentum confirmation).
**Risk Management Integration**
**Signal Priority:**
1. **Highest**: Strong signals with divergence (blue/magenta triangles)
2. **Medium**: Primary signals without divergence (light green/red triangles)
3. **Confirmation**: Momentum signals (tiny circles)
**Position Sizing:**
- Larger positions on strong signals (divergence present)
- Standard positions on primary signals
- Smaller positions or adds on momentum signals
**Stop Placement:**
- Beyond recent swing structure
- Below/above divergence swing low/high for strong signals
- Trail stops when momentum signals align with position
**Alert System**
Built-in alert conditions for:
- Buy Signal: RSI buy without divergence
- Sell Signal: RSI sell without divergence
- Strong Buy Alert: Buy with bullish divergence
- Strong Sell Alert: Sell with bearish divergence
Configure alerts via TradingView's alert system to receive notifications for chosen signal types.
**Important Considerations**
**Strengths:**
- Multiple confirmation layers reduce false signals
- Classical divergence improves reversal detection
- Momentum signals add trend-following capability
- Highly customizable for different trading styles
- No repainting - all signals fixed at bar close
**Limitations:**
- Duration requirements may cause missed quick reversals
- Divergence lookback period affects sensitivity
- Not suitable as standalone system
- Requires understanding of RSI principles and divergence concepts
**Best Practices:**
- Combine with price action and support/resistance
- Use higher timeframe context for directional bias
- Respect overall market trend and structure
- Implement proper position sizing based on signal type
- Test parameters on your specific instrument and timeframe
**Comparison Summary**
This enhanced version represents a significant upgrade:
- Upgraded to Pine Script v5 modern standards
- Proper classical divergence detection (not simplified)
- Added momentum confirmation signals
- Fully customizable parameters via inputs
- Visual background zone highlighting
- Comprehensive alert system
- Better signal differentiation through color coding
The system transforms basic RSI analysis into a multi-dimensional trading tool suitable for various market conditions and trading styles.
**Disclaimer**: This indicator is designed for educational and analytical purposes. While the multi-layer filtering and classical divergence detection improve upon standard RSI implementations, no indicator guarantees profitable trades. The duration filtering reduces false signals but may delay entries. Divergence signals, while statistically favorable, can fail in strong trending conditions. Always use proper risk management, position sizing, and stop-loss orders. Consider multiple confirmation methods and market context before making trading decisions. Past performance does not guarantee future results.

Dynamic Swing Anchored VWAP STRAT (Zeiierman/PineIndicators)Dynamic Swing Anchored VWAP STRATEGY — Zeiierman × PineIndicators (Pine Script v6)
A pivot-to-pivot Anchored VWAP strategy that adapts to volatility, enters long on bullish structure, and closes on bearish structure. Built for TradingView in Pine Script v6.
Full credits to zeiierman.
Repainting notice: The original indicator logic is repainting. Swing labels (HH/HL/LH/LL) are finalized after enough bars have printed, so labels do not occur in real time. It is not possible to execute at historical label points. Treat results as educational and validate with Bar Replay and paper trading before considering any discretionary use.
Concept
The script identifies swing highs/lows over a user-defined lookback ( Swing Period ). When structure flips (most recent swing low is newer than the most recent swing high, or vice versa), a new regime begins.
At each confirmed pivot, a fresh Anchored VWAP segment is started and updated bar-by-bar using an EWMA-style decay on price×volume and volume.
Responsiveness is controlled by Adaptive Price Tracking (APT) . Optionally, APT auto-adjusts with an ATR ratio so that high volatility accelerates responsiveness and low volatility smooths it.
Longs are opened/held in bullish regimes and closed when the regime turns bearish. No short positions are taken by design.
How it works (under the hood)
Swing detection: Uses ta.highestbars / ta.lowestbars over prd to update swing highs (ph) and lows (pl), plus their bar indices (phL, plL).
Regime logic: If phL > plL → bullish regime; else → bearish regime. A change in this condition triggers a re-anchor of the VWAP at the newest pivot.
Adaptive VWAP math: APT is converted to an exponential decay factor ( alphaFromAPT ), then applied to running sums of price×volume and volume, producing the current VWAP estimate.
Rendering: Each pivot-anchored VWAP segment is drawn as a polyline and color-coded by regime. Optional structure labels (HH/HL/LH/LL) annotate the swing character.
Orders: On bullish flips, strategy.entry("L") opens/maintains a long; on bearish flips, strategy.close("L") exits.
Inputs & controls
Swing Period (prd) — Higher values identify larger, slower swings; lower values catch more frequent pivots but add noise.
Adaptive Price Tracking (APT) — Governs the VWAP’s “half-life.” Smaller APT → faster/closer to price; larger APT → smoother/stabler.
Adapt APT by ATR ratio — When enabled, APT scales with volatility so the VWAP speeds up in turbulent markets and slows down in quiet markets.
Volatility Bias — Tunes the strength of APT’s response to volatility (above 1 = stronger effect; below 1 = milder).
Style settings — Colors for swing labels and VWAP segments, plus line width for visibility.
Trade logic summary
Entry: Long when the swing structure turns bullish (latest swing low is more recent than the last swing high).
Exit: Close the long when structure turns bearish.
Position size: qty = strategy.equity / close × 5 (dynamic sizing; scales with account equity and instrument price). Consider reducing the multiplier for a more conservative profile.
Recommended workflow
Apply to instruments with reliable volume (equities, futures, crypto; FX tick volume can work but varies by broker).
Start on your preferred timeframe. Intraday often benefits from smaller APT (more reactive); higher timeframes may prefer larger APT (smoother).
Begin with defaults ( prd=50, APT=20 ); then toggle “Adapt by ATR” and vary Volatility Bias to observe how segments tighten/loosen.
Use Bar Replay to watch how pivots confirm and how the strategy re-anchors VWAP at those confirmations.
Layer your own risk rules (stops/targets, max position cap, session filters) before any discretionary use.
Practical tips
Context filter: Consider combining with a higher-timeframe bias (e.g., daily trend) and using this strategy as an entry timing layer.
First pivot preference: Some traders prefer only the first bullish pivot after a bearish regime (and vice versa) to reduce whipsaw in choppy ranges.
Deviations: You can add VWAP deviation bands to pre-plan partial exits or re-entries on mean-reversion pulls.
Sessions: Session-based filters (RTH vs. ETH) can materially change behavior on futures and equities.
Extending the script (ideas)
Add stops/targets (e.g., ATR stop below last swing low; partial profits at k×VWAP deviation).
Introduce mirrored short logic for two-sided testing.
Include alert conditions for regime flips or for price-VWAP interactions.
Incorporate HTF confirmation (e.g., only long when daily VWAP slope ≥ 0).
Throttle entries (e.g., once per regime flip) to avoid over-trading in ranges.
Known limitations
Repainting: Swing labels and pivot confirmations depend on future bars; historical labels can look “perfect.” Treat them as annotations, not executable signals.
Execution realism: Strategy includes commission and slippage fields, yet actual fills differ by venue/liquidity.
No guarantees: Past behavior does not imply future results. This publication is for research/education only and not financial advice.
Defaults (backtest environment)
Initial capital: 10,000
Commission value: 0.01
Slippage: 1
Overlay: true
Max bars back: 5000; Max labels/polylines set for deep swing histories
Quick checklist
Add to chart and verify that the instrument has volume.
Use defaults, then tune APT and Volatility Bias with/without ATR adaptation.
Observe how each pivot re-anchors VWAP and how regime flips drive entries/exits.
Paper trade across several symbols/timeframes before any discretionary decisions.
Attribution & license
Original indicator concept and logic: Zeiierman — please credit the author.
Strategy wrapper and publication: PineIndicators .
License: CC BY-NC-SA 4.0 (Attribution-NonCommercial-ShareAlike). Respect the license when forking or publishing derivatives.

Trend FriendTrend Friend — What it is and how to use it
I built Trend Friend to stop redrawing the same trendlines all day. It automatically connects confirmed swing points (fractals) and keeps the most relevant lines in front of you. The goal: give you clean, actionable structure without the guesswork.
What it does (in plain English)
Finds swing highs/lows using a Fractal Period you choose.
Draws auto-trendlines between the two most recent confirmed highs and the two most recent confirmed lows.
Colours by intent:
Lines drawn from highs (potential resistance / bearish) = Red
Lines drawn from lows (potential support / bullish) = Green
Keeps the chart tidy: The newest lines are styled as “recent,” older lines are dimmed as “historical,” and it prunes anything beyond your chosen limit.
Optional crosses & alerts: You can highlight when price closes across the most recent line and set alerts for new lines formed and upper/lower line crosses.
Structure labels: It tags HH, LH, HL, LL at the swing points, so you can quickly read trend/rotation.
How it works (under the hood)
A “fractal” here is a confirmed pivot: the highest high (or lowest low) with n bars on each side. That means pivots only confirm after n bars, so signals are cleaner and less noisy.
When a new pivot prints, the script connects it to the prior pivot of the same type (high→high, low→low). That gives you one “bearish” line from highs and one “bullish” line from lows.
The newest line is marked as recent (brighter), and the previous recent line becomes historical (dimmed). You can keep as many pairs as you want, but I usually keep it tight.
Inputs you’ll actually use
Fractal Period (n): this is the big one. It controls how swingy/strict the pivots are.
Lower n → more swings, more lines (faster, noisier)
Higher n → fewer swings, cleaner lines (slower, swing-trade friendly)
Max pair of lines: how many pairs (up+down) to keep on the chart. 1–3 is a sweet spot.
Extend: extend lines Right (my default) or Both ways if you like the context.
Line widths & colours: recent vs. historical are separate so you can make the active lines pop.
Show crosses: toggle the X markers when price crosses a line. I turn this on when I’m actively hunting breakouts/retests.
Reading the chart
Red lines (from highs): I treat these as potential resistance. A clean break + hold above a red line often flips me from “fade” to “follow.”
Green lines (from lows): Potential support. Same idea in reverse: break + hold below and I stop buying dips until I see structure reclaim.
HH / LH / HL / LL dots: quick read on structure.
HH/HL bias = uptrend continuation potential
LH/LL bias = downtrend continuation potential
Mixed prints = rotation/chop—tighten risk or wait for clarity.
My H1 guidance (fine-tuning Fractal Period)
If you’re mainly on H1 (my use case), tune like this:
Fast / aggressive: n = 6–8 (lots of signals, good for momentum days; more chop risk)
Balanced (recommended): n = 9–12 (keeps lines meaningful but responsive)
Slow / swing focus: n = 13–21 (filters noise; better for trend days and higher-TF confluence)
Rule of thumb: if you’re getting too many touches and whipsaws, increase n. If you’re late to obvious breaks, decrease n.
How I trade it (example workflow)
Pick your n for the session (H1: start at 9–12).
Mark the recent red & green lines. That’s your immediate structure.
Look for interaction:
Rejections from a line = fade potential back into the range.
Break + close across a line = watch the retest for continuation.
Confirm with context: session bias, HTF structure, and your own tools (VWAP, RSI, volume, FVG/OB, etc.).
Plan the trade: enter on retest or reclaim, stop beyond the line/last swing, target the opposite side or next structure.
Alerts (set and forget)
“New trendline formed” — fires when a new high/low pivot confirms and a fresh line is drawn.
“Upper/lower trendline crossed” — fires when price crosses the most recent red/green line.
Use these to track structure shifts without staring at the screen.
Good to know (honest limitations)
Confirmation lag: pivots need n bars on both sides, so signals arrive after the swing confirms. That’s by design—less noise, fewer fake lines.
Lines update as structure evolves: when a new pivot forms, the previous “recent” line becomes “historical,” and older ones can be removed based on your max setting.
Not an auto trendline crystal ball: it won’t predict which line holds or breaks—it just keeps the most relevant structure clean and up to date.
Final notes
Works on any timeframe; I built it with H1 in mind and scale to H4/D1 by increasing n.
Pairs nicely with session tools and VWAP for intraday, or with supply/demand / FVGs for swing planning.
Risk first: lines are structure, not guarantees. Manage position size and stops as usual.
Not financial advice. Trade your plan. Stay nimble.

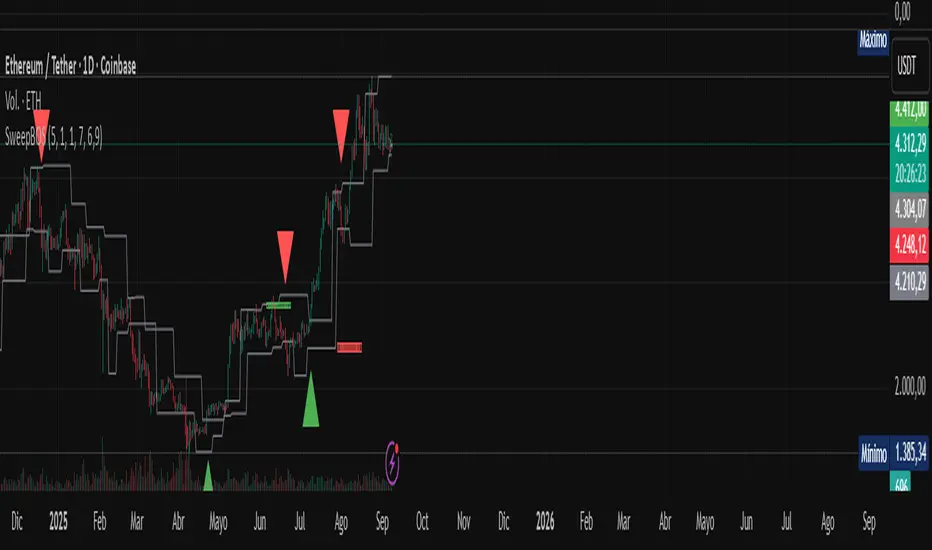
Sweep + BOS Alerts//@version=5
indicator("Sweep + BOS Alerts", overlay=true, shorttitle="SweepBOS")
// === User inputs ===
// Lookback length for pivot highs/lows. Higher values produce fewer swings/signals.
length = input.int(5, title="Pivot length", minval=1, maxval=50)
// Minimum relative wick size to qualify as a sweep (ratio of wick to body)
minWickMult = input.float(1.5, title="Min wick‑to‑body ratio", minval=0.0)
// Volume confirmation multiplier: volume must be at least this multiple of average volume
volMult = input.float(1.0, title="Volume multiple for BOS confirmation", minval=0.0)
// Maximum signals per month (to limit to ~5–7 as requested)
maxSignals = input.int(7, title="Max signals per month", minval=1, maxval=20)
// Only alert once per sweep/BOS pair
onlyFirst = input.bool(true, title="Only first BOS after sweep")
// === Helpers ===
// Identify pivot highs/lows using built‑in pivot functions
pivotHighPrice = ta.pivothigh(high, length, length)
pivotLowPrice = ta.pivotlow(low, length, length)
// Track the most recent swing high/low and their bar indices
var float lastSwingHigh = na
var float lastSwingLow = na
var int lastSwingHighBar = na
var int lastSwingLowBar = na
if not na(pivotHighPrice)
lastSwingHigh := pivotHighPrice
lastSwingHighBar := bar_index - length
if not na(pivotLowPrice)
lastSwingLow := pivotLowPrice
lastSwingLowBar := bar_index - length
// Calculate average volume for confirmation
avgVol = ta.sma(volume, 20)
// === Sweep detection ===
// Flags to signal a sweep occurred and BOS expected
var bool awaitingBearBOS = false
var bool awaitingBullBOS = false
// Check for sell sweep (buyside liquidity sweep)
// Condition: current high breaks previous swing high and closes back below the swing high with a long upper wick
bearSweep = false
if (not na(lastSwingHigh) and high > lastSwingHigh)
// compute candle components
bodySize = math.abs(close - open)
upperWick = high - math.max(open, close)
isLongUpperWick = bodySize > 0 ? upperWick / bodySize >= minWickMult : false
// price closes below the last swing high (reversion inside range)
closesInside = close < lastSwingHigh
bearSweep := isLongUpperWick and closesInside
// Check for buy sweep (sellside liquidity sweep)
bullSweep = false
if (not na(lastSwingLow) and low < lastSwingLow)
bodySize = math.abs(close - open)
lowerWick = math.min(open, close) - low
isLongLowerWick = bodySize > 0 ? lowerWick / bodySize >= minWickMult : false
closesInside = close > lastSwingLow
bullSweep := isLongLowerWick and closesInside
// When sweep occurs, set awaiting BOS flags
if bearSweep
awaitingBearBOS := true
awaitingBullBOS := false
if bullSweep
awaitingBullBOS := true
awaitingBearBOS := false
// === BOS detection ===
// Evaluate BOS only if a sweep has happened
autoSellSignal = false
autoBuySignal = false
if awaitingBearBOS
// Look for break of structure to downside: close lower than last swing low.
// Confirm with volume if needed: if average volume is zero (e.g. at start of data), accept any volume.
bool volOkDown = (avgVol == 0) or (volume >= volMult * avgVol)
if (not na(lastSwingLow) and close < lastSwingLow and volOkDown)
autoSellSignal := true
// If only first BOS should trigger, reset flag; otherwise keep awaiting further BOS
awaitingBearBOS := not onlyFirst
if awaitingBullBOS
// Look for break of structure to upside: close higher than last swing high.
bool volOkUp = (avgVol == 0) or (volume >= volMult * avgVol)
if (not na(lastSwingHigh) and close > lastSwingHigh and volOkUp)
autoBuySignal := true
awaitingBullBOS := not onlyFirst
// === Signal throttling per month ===
// Convert current date to month index (year*12 + month)
monthIndex = year * 12 + month
var int currentMonth = monthIndex
var int signalCount = 0
if monthIndex != currentMonth
currentMonth := monthIndex
signalCount := 0
// Limit number of signals per month
buyAllowed = autoBuySignal and (signalCount < maxSignals)
sellAllowed = autoSellSignal and (signalCount < maxSignals)
if buyAllowed or sellAllowed
signalCount += 1
// === Plotting signals ===
plotshape(buyAllowed, title="Buy Signal", style=shape.triangleup, location=location.belowbar, color=color.new(color.green, 0), size=size.tiny, text="BUY")
plotshape(sellAllowed, title="Sell Signal", style=shape.triangledown, location=location.abovebar, color=color.new(color.red, 0), size=size.tiny, text="SELL")
// Plot swing levels (optional for visual reference)
plot(lastSwingHigh, title="Swing High", color=color.gray, style=plot.style_linebr)
plot(lastSwingLow, title="Swing Low", color=color.gray, style=plot.style_linebr)
// === Alerts ===
// These alertconditions allow TradingView to trigger notifications
alertcondition(buyAllowed, title="Buy Alert", message="Sweep+BOS Buy signal on {{exchange}} {{ticker}} @ {{close}} on {{interval}}")
alertcondition(sellAllowed, title="Sell Alert", message="Sweep+BOS Sell signal on {{exchange}} {{ticker}} @ {{close}} on {{interval}}")
Ichimoku + SuperTrend + Oscillator + Divergence + SMC Lite//@version=5
indicator("Ichimoku + SuperTrend + Oscillator + Divergence + SMC Lite", overlay=true, max_labels_count=500, max_lines_count=500, max_boxes_count=500, max_bars_back=1000)
// ====================
// === CODE BLOCK 1: Ichimoku + SuperTrend + Oscillator Monitor + Divergence ===
// ====================
// --- User Inputs ---
lowerTF = input.timeframe("5", "Lower Timeframe (Ichimoku + SuperTrend)")
higherTF = input.timeframe("60", "Higher Timeframe (Tenkan/Kijun check)")
tenkanLength = input.int(9, "Tenkan-sen Length (Lower TF)")
kijunLength = input.int(26, "Kijun-sen Length (Lower TF)")
senkouSpanBLength = input.int(52, "Senkou Span B Length (Lower TF)")
displacement = input.int(26, "Displacement (Lower TF)")
showCloud = input.bool(true, "Show Kumo Cloud (Lower TF)")
buyColor = input.color(color.new(color.green, 0), "Buy Candle Color")
sellColor = input.color(color.new(color.red, 0), "Sell Candle Color")
crossCandleColor = input.color(color.new(color.yellow, 0), "Cross Candle Color")
bodyFilterColor = input.color(color.new(color.lime,0), "Body Filter Active Color")
htfCrossColor = input.color(color.new(color.orange,0), "HTF Cross Signal Color")
stopColor = input.color(color.new(color.red,0), "Stop Line Color")
targetColor = input.color(color.new(color.blue,0), "Target Line Color")
cooldownBars = input.int(5, "Cooldown Bars After Signal")
// --- Higher TF Ichimoku ---
tenkanLengthHTF = input.int(36, "Tenkan Length (Higher TF)")
kijunLengthHTF = input.int(103, "Kijun Length (Higher TF)")
showTenkanHTF = input.bool(true, "Show Tenkan (HTF)")
showKijunHTF = input.bool(true, "Show Kijun (HTF)")
tenkanHTFValue = request.security(syminfo.tickerid, higherTF, (ta.highest(high, tenkanLengthHTF)+ta.lowest(low, tenkanLengthHTF))/2)
kijunHTFValue = request.security(syminfo.tickerid, higherTF, (ta.highest(high, kijunLengthHTF)+ta.lowest(low, kijunLengthHTF))/2)
plot(showTenkanHTF ? tenkanHTFValue : na, color=color.blue, linewidth=2, title="Tenkan HTF")
plot(showKijunHTF ? kijunHTFValue : na, color=color.red, linewidth=2, title="Kijun HTF")
// --- Lower TF Ichimoku ---
tenkan = request.security(syminfo.tickerid, lowerTF, (ta.highest(high, tenkanLength) + ta.lowest(low, tenkanLength)) / 2)
kijun = request.security(syminfo.tickerid, lowerTF, (ta.highest(high, kijunLength) + ta.lowest(low, kijunLength)) / 2)
senkouA = request.security(syminfo.tickerid, lowerTF, (tenkan + kijun) / 2)
senkouB = request.security(syminfo.tickerid, lowerTF, (ta.highest(high, senkouSpanBLength) + ta.lowest(low, senkouSpanBLength)) / 2)
plot(tenkan, color=color.blue, title="Tenkan-sen (LTF)", linewidth=2)
plot(kijun, color=color.red, title="Kijun-sen (LTF)", linewidth=2)
sA = plot(senkouA , display=display.none)
sB = plot(senkouB , display=display.none)
cloudColor = showCloud ? (senkouA > senkouB ? color.new(color.green, 80) : color.new(color.red, 80)) : na
fill(sA, sB, color=cloudColor)
// --- Detect Crosses ---
crossUp = ta.crossover(tenkan, kijun)
crossDown = ta.crossunder(tenkan, kijun)
crossUpHTF = ta.crossover(tenkanHTFValue, kijunHTFValue)
crossDownHTF = ta.crossunder(tenkanHTFValue, kijunHTFValue)
candle2AboveCloud = close > math.max(senkouA , senkouB )
candle2BelowCloud = close < math.min(senkouA , senkouB )
// --- SuperTrend Lower TF ---
atrPeriodLTF = 12
multiplierLTF = 3.0
atrValueLTF = ta.atr(atrPeriodLTF)
upLTF = hl2 - multiplierLTF * atrValueLTF
dnLTF = hl2 + multiplierLTF * atrValueLTF
var int trendLTF = 1
trendLTF := trendLTF == -1 and close > dnLTF ? 1 : trendLTF == 1 and close < upLTF ? -1 : trendLTF
// --- SuperTrend Higher TF ---
useHTFST = input.bool(true, "Use HTF SuperTrend")
atrPeriodHTF = input.int(12, "HTF SuperTrend ATR")
multiplierHTF = input.float(3.0, "HTF SuperTrend Multiplier")
hl2HTF = request.security(syminfo.tickerid, higherTF, hl2)
atrHTF = request.security(syminfo.tickerid, higherTF, ta.atr(atrPeriodHTF))
upHTF = hl2HTF - multiplierHTF * atrHTF
dnHTF = hl2HTF + multiplierHTF * atrHTF
var int trendHTF = 1
trendHTF := trendHTF == -1 and close > dnHTF ? 1 : trendHTF == 1 and close < upHTF ? -1 : trendHTF
// --- Body Filter ---
useBodyFilter = input.bool(true, "Use Body Filter")
bodyMinPerc = input.float(20, "Min Body %")
bodyMaxPerc = input.float(100, "Max Body %")
bodyLen = math.abs(close - open)
candleLen = high - low
bodyPerc = (bodyLen / candleLen) * 100
bodyFilterPass = not useBodyFilter or (bodyPerc >= bodyMinPerc and bodyPerc <= bodyMaxPerc)
// --- Reward Filter ---
useReward = input.bool(true, "Use Reward 1:1 Filter")
stopLossPerc = input.float(1.5, "Stop Loss %")
reward1 = input.float(1.0, "Target 1 R/R")
reward2 = input.float(2.0, "Target 2 R/R")
reward3 = input.float(3.0, "Target 3 R/R")
rewardPass = not useReward or ((math.abs(close - tenkanHTFValue) * reward1) <= math.abs(kijunHTFValue - close))
// --- TSI Higher TF ---
tsiLong = input.int(25, "TSI Long")
tsiShort = input.int(13, "TSI Short")
tsiHTF = ta.tsi(request.security(syminfo.tickerid, higherTF, close), tsiLong, tsiShort)
// --- Lower TF Signals ---
buySignalLTF = (crossUp and candle2AboveCloud) and trendLTF == 1
sellSignalLTF = (crossDown and candle2BelowCloud) and trendLTF == -1
plotshape(crossUpHTF, title="HTF Buy Cross", location=location.belowbar, color=htfCrossColor, style=shape.triangleup, size=size.small)
plotshape(crossDownHTF, title="HTF Sell Cross", location=location.abovebar, color=htfCrossColor, style=shape.triangledown, size=size.small)
buyConfirmedRaw = (buySignalLTF and close > tenkanHTFValue and (not useHTFST or trendHTF==1)) and rewardPass and (tsiHTF > 0)
sellConfirmedRaw = (sellSignalLTF and close < tenkanHTFValue and (not useHTFST or trendHTF==-1)) and rewardPass and (tsiHTF < 0)
// --- Cooldown ---
var int barsSinceSignal = cooldownBars
barsSinceSignal += 1
buyConfirmed = buyConfirmedRaw and barsSinceSignal >= cooldownBars
sellConfirmed = sellConfirmedRaw and barsSinceSignal >= cooldownBars
if buyConfirmed or sellConfirmed
barsSinceSignal := 0
// --- Plot Final Signals ---
plotshape(buyConfirmed and bodyFilterPass, title="Buy Signal", location=location.belowbar, color=buyColor, style=shape.triangleup, size=size.small)
plotshape(sellConfirmed and bodyFilterPass, title="Sell Signal", location=location.abovebar, color=sellColor, style=shape.triangledown, size=size.small)
plotshape(buyConfirmed and not bodyFilterPass, title="Buy Signal (Filtered)", location=location.belowbar, color=bodyFilterColor, style=shape.triangleup, size=size.tiny)
plotshape(sellConfirmed and not bodyFilterPass, title="Sell Signal (Filtered)", location=location.abovebar, color=bodyFilterColor, style=shape.triangledown, size=size.tiny)
barcolor(crossUp or crossDown ? crossCandleColor : na)
barcolor(buyConfirmed and bodyFilterPass ? buyColor : sellConfirmed and bodyFilterPass ? sellColor : na)
// --- Stop & Targets ---
var float lastBuyPrice = na
var float lastSellPrice = na
var bool buyActive = false
var bool sellActive = false
f_drawLine(_price) =>
line.new(bar_index, _price, bar_index+3, _price, color=targetColor, width=2, style=line.style_dotted)
if buyConfirmed and not buyActive and not sellActive
buyActive := true
lastBuyPrice := close
line.new(bar_index, close*(1-stopLossPerc/100), bar_index+3, close*(1-stopLossPerc/100), color=stopColor, width=2, style=line.style_dotted)
f_drawLine(close*(1+reward1/100))
f_drawLine(close*(1+reward2/100))
f_drawLine(close*(1+reward3/100))
if buyActive
if low <= lastBuyPrice*(1-stopLossPerc/100) or high >= lastBuyPrice*(1+reward1/100)
buyActive := false
if sellConfirmed and not sellActive and not buyActive
sellActive := true
lastSellPrice := close
line.new(bar_index, close*(1+stopLossPerc/100), bar_index+3, close*(1+stopLossPerc/100), color=stopColor, width=2, style=line.style_dotted)
f_drawLine(close*(1-reward1/100))
f_drawLine(close*(1-reward2/100))
f_drawLine(close*(1-reward3/100))
if sellActive
if high >= lastSellPrice*(1+stopLossPerc/100) or low <= lastSellPrice*(1-reward1/100)
sellActive := false
// --- Oscillator Panel ---
showPanel = input.bool(true, "Show Oscillator Panel")
panelX = input.int(20, "Panel X Offset (Bars)")
panelY = input.int(50, "Panel Y Offset (Pixels)")
panelBgColor = input.color(color.new(color.black, 85), "Panel Background Color")
panelTextSize = input.string("normal", "Text Size", options= )
// MACD
macdFast = input.int(12)
macdSlow = input.int(26)
macdSignal= input.int(9)
= ta.macd(close, macdFast, macdSlow, macdSignal)
macdBull = macdLine > signalLine
// RSI
rsiLen = input.int(14)
rsiVal = ta.rsi(close, rsiLen)
rsiBull = rsiVal > 50
// TSI
tsiVal = ta.tsi(close, 25, 13)
tsiBull = tsiVal > 0
// Divergence detection (RSI, MACD, TSI)
leftBars = input.int(2)
rightBars = input.int(2)
rsiLow = ta.pivotlow(rsiVal, leftBars, rightBars)
rsiHigh = ta.pivothigh(rsiVal, leftBars, rightBars)
bullDivRSI = not na(rsiLow) and low < low and rsiVal > rsiVal
bearDivRSI = not na(rsiHigh) and high > high and rsiVal < rsiVal
macdLow = ta.pivotlow(macdLine, leftBars, rightBars)
macdHigh = ta.pivothigh(macdLine, leftBars, rightBars)
bullDivMACD = not na(macdLow) and low < low and macdLine > macdLine
bearDivMACD = not na(macdHigh) and high > high and macdLine < macdLine
tsiLow = ta.pivotlow(tsiVal, leftBars, rightBars)
tsiHigh = ta.pivothigh(tsiVal, leftBars, rightBars)
bullDivTSI = not na(tsiLow) and low < low and tsiVal > tsiVal
bearDivTSI = not na(tsiHigh) and high > high and tsiVal < tsiVal
// Plot divergence on chart
plotshape(bullDivRSI, style=shape.labelup, text="R d+", color=color.lime, textcolor=color.white, location=location.belowbar, size=size.tiny)
plotshape(bearDivRSI, style=shape.labeldown, text="R d-", color=color.red, textcolor=color.white, location=location.abovebar, size=size.tiny)
plotshape(bullDivMACD, style=shape.labelup, text="M d+", color=color.lime, textcolor=color.white, location=location.belowbar, size=size.tiny)
plotshape(bearDivMACD, style=shape.labeldown, text="M d-", color=color.red, textcolor=color.white, location=location.abovebar, size=size.tiny)
plotshape(bullDivTSI, style=shape.labelup, text="T d+", color=color.lime, textcolor=color.white, location=location.belowbar, size=size.tiny)
plotshape(bearDivTSI, style=shape.labeldown, text="T d-", color=color.red, textcolor=color.white, location=location.abovebar, size=size.tiny)
// Panel
var label panelLabel = label.new(bar_index + panelX, close, "", xloc=xloc.bar_index, yloc=yloc.price, style=label.style_label_left, color=panelBgColor, size=panelTextSize)
if showPanel
label.set_xy(panelLabel, bar_index + panelX, close + panelY * syminfo.mintick)
label.set_text(panelLabel, "MACD: " + (macdBull ? "↑" : "↓") + (bullDivMACD ? " d+" : bearDivMACD ? " d-" : "") + "\n" +
"RSI : " + (rsiBull ? "↑" : "↓") + (bullDivRSI ? " d+" : bearDivRSI ? " d-" : "") + "\n" +
"TSI : " + (tsiBull ? "↑" : "↓") + (bullDivTSI ? " d+" : bearDivTSI ? " d-" : "") + "\n" +
"ST : " + (trendLTF==1 ? "↑" : "↓"))
label.set_textcolor(panelLabel, color.white)
// ====================
// === CODE BLOCK 2: FluidTrades - SMC Lite (Light) ===
// ====================
// === SETTINGS ===
swing_length = input.int(10, "Swing High/Low Length", minval=1, maxval=50)
history_keep = input.int(20, "History To Keep", minval=5, maxval=50)
box_width = input.float(2.5, "Supply/Demand Box Width", minval=1, maxval=10, step=0.5)
show_labels = input.bool(false, "Show Price Action Labels")
supply_color = input.color(color.new(#EDEDED,70), "Supply Color")
supply_outline = input.color(color.new(color.white,75), "Supply Outline")
demand_color = input.color(color.new(#00FFFF,70), "Demand Color")
demand_outline = input.color(color.new(color.white,75), "Demand Outline")
bos_color = input.color(color.white, "BOS Label Color")
poi_color = input.color(color.white, "POI Label Color")
label_color = input.color(color.black, "Swing Label Color")
// === FUNCTIONS ===
f_add_pop(arr, val) =>
array.unshift(arr, val)
array.pop(arr)
f_draw_swing_label(values, swing_type) =>
var string txt = na
if swing_type == 1
txt := array.get(values,0) >= array.get(values,1) ? "HH" : "LH"
label.new(bar_index - swing_length, array.get(values,0), txt, style=label.style_label_down, textcolor=label_color, color=color.new(label_color,100), size=size.tiny)
else
txt := array.get(values,0) >= array.get(values,1) ? "HL" : "LL"
label.new(bar_index - swing_length, array.get(values,0), txt, style=label.style_label_up, textcolor=label_color, color=color.new(label_color,100), size=size.tiny)
f_check_overlap(new_poi, box_arr, atr) =>
ok = true
for i=0 to array.size(box_arr)-1
b = array.get(box_arr,i)
top = box.get_top(b)
bot = box.get_bottom(b)
mid = (top+bot)/2
threshold = atr*2
if new_poi >= mid - threshold and new_poi <= mid + threshold
ok := false
break
ok
f_create_box(vals, bn_arr, box_arr, label_arr, type_box, atr) =>
atr_buf = atr*(box_width/10)
left = array.get(bn_arr,0)
right = bar_index
var float top=0.0
var float bottom=0.0
var float poi=0.0
if type_box==1
top := array.get(vals,0)
bottom := top - atr_buf
else
bottom := array.get(vals,0)
top := bottom + atr_buf
poi := (top+bottom)/2
if f_check_overlap(poi, box_arr, atr)
box.delete(array.get(box_arr,array.size(box_arr)-1))
f_add_pop(box_arr, box.new(left, top, right, bottom, border_color=type_box==1?supply_outline:demand_outline,
bgcolor=type_box==1?supply_color:demand_color, extend=extend.right, text=type_box==1?"SUPPLY":"DEMAND",
text_halign=text.align_center, text_valign=text.align_center, text_color=poi_color, text_size=size.small, xloc=xloc.bar_index))
box.delete(array.get(label_arr,array.size(label_arr)-1))
f_add_pop(label_arr, box.new(left, poi, right, poi, border_color=color.new(poi_color,90),
bgcolor=color.new(poi_color,90), extend=extend.right, text="POI", text_halign=text.align_left, text_valign=text.align_center, text_color=poi_color, text_size=size.small, xloc=xloc.bar_index))
f_to_bos(box_arr, bos_arr, label_arr, type_box) =>
for i=0 to array.size(box_arr)-1
b = array.get(box_arr,i)
lvl = type_box==1? box.get_top(b) : box.get_bottom(b)
cond = type_box==1? close>=lvl : close<=lvl
if cond
cbox = box.copy(b)
f_add_pop(bos_arr, cbox)
mid = (box.get_top(b)+box.get_bottom(b))/2
box.set_top(cbox, mid)
box.set_bottom(cbox, mid)
box.set_extend(cbox, extend.none)
box.set_right(cbox, bar_index)
box.set_text(cbox, "BOS")
box.set_text_color(cbox, bos_color)
box.set_text_size(cbox, size.small)
box.set_text_halign(cbox, text.align_center)
box.set_text_valign(cbox, text.align_center)
box.delete(b)
box.delete(array.get(label_arr,i))
f_extend(box_arr) =>
for i=0 to array.size(box_arr)-1
box.set_right(array.get(box_arr,i), bar_index+100)
// === CALCULATIONS ===
atr = ta.atr(50)
swing_high = ta.pivothigh(high, swing_length, swing_length)
swing_low = ta.pivotlow(low, swing_length, swing_length)
var swing_high_vals = array.new_float(5,0.0)
var swing_low_vals = array.new_float(5,0.0)
var swing_high_bn = array.new_int(5,0)
var swing_low_bn = array.new_int(5,0)
var supply_boxes = array.new_box(history_keep, na)
var demand_boxes = array.new_box(history_keep, na)
var supply_poi = array.new_box(history_keep, na)
var demand_poi = array.new_box(history_keep, na)
var bos_supply = array.new_box(5, na)
var bos_demand = array.new_box(5, na)
// NEW SWING HIGH
if not na(swing_high)
f_add_pop(swing_high_vals, swing_high)
f_add_pop(swing_high_bn, bar_index )
if show_labels
f_draw_swing_label(swing_high_vals,1)
f_create_box(swing_high_vals, swing_high_bn, supply_boxes, supply_poi, 1, atr)
// NEW SWING LOW
if not na(swing_low)
f_add_pop(swing_low_vals, swing_low)
f_add_pop(swing_low_bn, bar_index )
if show_labels
f_draw_swing_label(swing_low_vals,-1)
f_create_box(swing_low_vals, swing_low_bn, demand_boxes, demand_poi, -1, atr)
f_to_bos(supply_boxes, bos_supply, supply_poi, 1)
f_to_bos(demand_boxes, bos_demand, demand_poi, -1)
f_extend(supply_boxes)
f_extend(demand_boxes)
//@version=6
length = input.int(9, minval=1)
src = input(close, title="Source")
e1 = ta.ema(src, length)
e2 = ta.ema(e1, length)
dema = 2 * e1 - e2
plot(dema, "DEMA", color=#43A047)

02 SMC + BB Breakout (Improved)This strategy combines Smart Money Concepts (SMC) with Bollinger Band breakouts to identify potential trading opportunities. SMC focuses on identifying key price levels and market structure shifts, while Bollinger Bands help pinpoint overbought/oversold conditions and potential breakout points. The strategy also incorporates higher timeframe trend confirmation to filter out trades that go against the prevailing trend.
Key Components:
Bollinger Bands:
Calculated using a Simple Moving Average (SMA) of the closing price and a standard deviation multiplier.
The strategy uses the upper and lower bands to identify potential breakout points.
The SMA (basis) acts as a centerline and potential support/resistance level.
The fill between the upper and lower bands can be toggled by the user.
Higher Timeframe Trend Confirmation:
The strategy allows for optional confirmation of the current trend using a higher timeframe (e.g., daily).
It calculates the SMA of the higher timeframe's closing prices.
A bullish trend is confirmed if the higher timeframe's closing price is above its SMA.
This helps filter out trades that go against the prevailing long-term trend.
Smart Money Concepts (SMC):
Order Blocks:
Simplified as recent price clusters, identified by the highest high and lowest low over a specified lookback period.
These levels are considered potential areas of support or resistance.
Liquidity Zones (Swing Highs/Lows):
Identified by recent swing highs and lows, indicating areas where liquidity may be present.
The Swing highs and lows are calculated based on user defined lookback periods.
Market Structure Shift (MSS):
Identifies potential changes in market structure.
A bullish MSS occurs when the closing price breaks above a previous swing high.
A bearish MSS occurs when the closing price breaks below a previous swing low.
The swing high and low values used for the MSS are calculated based on the user defined swing length.
Entry Conditions:
Long Entry:
The closing price crosses above the upper Bollinger Band.
If higher timeframe confirmation is enabled, the higher timeframe trend must be bullish.
A bullish MSS must have occurred.
Short Entry:
The closing price crosses below the lower Bollinger Band.
If higher timeframe confirmation is enabled, the higher timeframe trend must be bearish.
A bearish MSS must have occurred.
Exit Conditions:
Long Exit:
The closing price crosses below the Bollinger Band basis.
Or the Closing price falls below 99% of the order block low.
Short Exit:
The closing price crosses above the Bollinger Band basis.
Or the closing price rises above 101% of the order block high.
Position Sizing:
The strategy calculates the position size based on a fixed percentage (5%) of the strategy's equity.
This helps manage risk by limiting the potential loss per trade.
Visualizations:
Bollinger Bands (upper, lower, and basis) are plotted on the chart.
SMC elements (order blocks, swing highs/lows) are plotted as lines, with user-adjustable visibility.
Entry and exit signals are plotted as shapes on the chart.
The Bollinger band fill opacity is adjustable by the user.
Trading Logic:
The strategy aims to capitalize on Bollinger Band breakouts that are confirmed by SMC signals and higher timeframe trend. It looks for breakouts that align with potential market structure shifts and key price levels (order blocks, swing highs/lows). The higher timeframe filter helps avoid trades that go against the overall trend.
In essence, the strategy attempts to identify high-probability breakout trades by combining momentum (Bollinger Bands) with structural analysis (SMC) and trend confirmation.
Key User-Adjustable Parameters:
Bollinger Bands Length
Standard Deviation Multiplier
Higher Timeframe
Higher Timeframe Confirmation (on/off)
SMC Elements Visibility (on/off)
Order block lookback length.
Swing lookback length.
Bollinger band fill opacity.
This detailed description should provide a comprehensive understanding of the strategy's logic and components.
***DISCLAIMER: This strategy is for educational purposes only. It is not financial advice. Past performance is not indicative of future results. Use at your own risk. Always perform thorough backtesting and forward testing before using any strategy in live trading.***

BBMA Strategy - EXT CSD CSM MHV RE CodesBINANCE:BTCUSD
Below is a detailed guide for using and interpreting the "BBMA Strategy - Enhanced EXT CSD CSM with Subplot" indicator. This guide is designed to be added to the description of the indicator when publishing it on TradingView. It provides clear instructions for users on how to apply the indicator, interpret its signals, and understand its features, including the multi-timeframe analysis and subplot table.
BBMA Strategy - Enhanced EXT CSD CSM with Subplot: User Guide
Overview
The "BBMA Strategy - Enhanced EXT CSD CSM with Subplot" is a comprehensive trading indicator built on the Bollinger Bands Moving Average (BBMA) framework. It combines multiple technical analysis tools—Bollinger Bands, Moving Averages (MAHI and MALO), EMA, ATR, volume analysis, RSI, MACD, market structure, and candlestick patterns—to identify high-probability trading setups. The indicator supports five key BBMA setups: EXT (Extreme), CSD (Consolidation), CSM (Continuation Setup Movement), RE (Re-Entry), and MHV (Market High Volatility).
This enhanced version includes:
Multi-Timeframe (MTF) Analysis: Confirms signals across a Lower Timeframe (LTF) and Higher Timeframe (HTF) for stronger trade validation.
Subplot Table: Displays signal status ("Active" or "Upcoming") and MTF confirmations in a clear table format.
Market Structure and Volume Filters: Incorporates Break of Structure (BOS), RSI divergence, and volume conditions to filter out low-probability trades.
Customizable Settings: Adjust Bollinger Bands, MA periods, timeframes, and more to suit your trading style.
This indicator is suitable for traders of all levels and can be used across various markets (e.g., forex, crypto, stocks) and timeframes (1M to 1D).
How to Use the Indicator
1. Add the Indicator to Your Chart
Open TradingView and load the chart of your chosen asset (e.g., BTCUSD, EURUSD, XAUUSD).
Go to the Pine Editor, paste the indicator code, and click "Add to Chart."
The indicator will overlay on your chart, displaying Bollinger Bands, Moving Averages, EMA, and signal labels. A subplot table will appear at the bottom of the chart.
2. Configure the Settings
The indicator provides customizable inputs to tailor it to your trading preferences. Access the settings by clicking the gear icon next to the indicator name on your chart:
Bollinger Bands Settings:
BB Period: Default is 20. Adjust the lookback period for Bollinger Bands.
BB Deviations: Default is 2. Adjust the standard deviation for the bands.
MAHI Settings (Moving Averages on High):
MAHI 5 Period: Default is 5. Period for the shorter MA on highs.
MAHI 10 Period: Default is 10. Period for the longer MA on highs.
MALO Settings (Moving Averages on Low):
MALO 5 Period: Default is 5. Period for the shorter MA on lows.
MALO 10 Period: Default is 10. Period for the longer MA on lows.
EMA Settings:
EMA Period: Default is 50. Adjust the period for the Exponential Moving Average.
ATR Settings:
ATR Period: Default is 14. Period for the Average True Range.
ATR SMA Period: Default is 14. Period for the ATR smoothing.
Timeframe Settings:
Minor HTF: Default is 1h. Select the minor higher timeframe for trend confirmation.
Major HTF: Default is 4h. Select the major higher timeframe for trend confirmation.
Lower TF for Confirmation: Default is 5m. Select the lower timeframe for signal confirmation.
Market Structure Settings:
Market Structure Lookback: Default is 10. Adjust the lookback period for swing highs/lows in market structure analysis.
3. Select Your Chart Timeframe
The indicator works on any timeframe from 1 minute (1M) to 1 day (1D).
For best results, align your chart timeframe (Current Timeframe, CTF) with the LTF and HTF settings:
Example: If CTF is 15m, set LTF to 5m and HTF to 1h or 4h.
This ensures proper multi-timeframe alignment for signal confirmation.
Indicator Components
Main Chart Elements
Bollinger Bands (BB): Plotted as three lines (upper, middle, lower) to identify volatility and potential reversal zones.
Upper Band: Blue line.
Middle Band: Black line (basis).
Lower Band: Blue line.
MAHI (Moving Averages on High): Two weighted moving averages on highs to detect trend direction.
MAHI 5: Green line.
MAHI 10: Lime line.
MALO (Moving Averages on Low): Two weighted moving averages on lows to confirm trend direction.
MALO 5: Red line.
MALO 10: Orange line.
EMA (50-period): Purple line to identify the overall trend.
Signal Labels: Appear on the chart when a setup is confirmed:
EXT Buy: Green upward arrow (reversal buy at BB lower band).
EXT Sell: Red downward arrow (reversal sell at BB upper band).
CSM Buy: Teal upward arrow (continuation buy above BB middle).
CSM Sell: Maroon downward arrow (continuation sell below BB middle).
RE Buy: Aqua upward arrow (re-entry buy between BB lower and middle).
RE Sell: Fuchsia downward arrow (re-entry sell between BB upper and middle).
MHV: Orange label (high volatility breakout after consolidation).
CSD: Yellow diamond (consolidation signal).
Subplot Table
Located at the bottom of the chart, the table summarizes signal status across three timeframes:
CTF (Current Timeframe): Shows "Active" (signal confirmed) or "Upcoming" (signal forming) for each setup.
LTF (Lower Timeframe): Displays a checkmark (✔) if the signal is confirmed on the LTF.
HTF (Higher Timeframe): Displays a checkmark (✔) if the signal is confirmed on the HTF.
Columns represent the five BBMA setups: EXT Buy, EXT Sell, CSD, CSM Buy, CSM Sell, RE Buy, RE Sell, and MHV.
Interpreting the Signals
1. EXT (Extreme) Setup
EXT Buy (Green Arrow):
Condition: Price touches or breaks below the BB lower band, closes above it, with high ATR volatility, strong volume, and additional confirmations (e.g., hammer candle, RSI oversold, MACD bullish, MAHI/MALO crossover, or bullish divergence).
Interpretation: A potential reversal buy signal. Look for confirmation in the subplot table (LTF and HTF rows).
Action: Consider a long position if LTF and HTF confirm (✔ in both rows). Use the BB middle or upper band as a target.
EXT Sell (Red Arrow):
Condition: Price touches or breaks above the BB upper band, closes below it, with high ATR volatility, strong volume, and additional confirmations (e.g., shooting star candle, RSI overbought, MACD bearish, MAHI/MALO crossunder, or bearish divergence).
Interpretation: A potential reversal sell signal.
Action: Consider a short position if LTF and HTF confirm. Use the BB middle or lower band as a target.
2. CSD (Consolidation) Setup
CSD (Yellow Diamond):
Condition: BB width is narrow (below its SMA), low ATR volatility, small candles, and no MAHI/MALO crossovers.
Interpretation: The market is consolidating, often preceding a breakout (e.g., MHV).
Action: Avoid trading during CSD unless preparing for an MHV breakout. Monitor the subplot for "Upcoming" MHV signals.
3. CSM (Continuation Setup Movement)
CSM Buy (Teal Arrow):
Condition: Price is above the BB middle, MAHI crossover, MALO crossover or MACD bullish, price above EMA 50, with additional confirmations (e.g., bullish engulfing or MACD bullish).
Interpretation: A continuation buy signal in an uptrend.
Action: Enter a long position if LTF and HTF confirm. Target the BB upper band or recent swing highs.
CSM Sell (Maroon Arrow):
Condition: Price is below the BB middle, MAHI crossunder, MALO crossunder or MACD bearish, price below EMA 50, with additional confirmations (e.g., bearish engulfing or MACD bearish).
Interpretation: A continuation sell signal in a downtrend.
Action: Enter a short position if LTF and HTF confirm. Target the BB lower band or recent swing lows.
4. RE (Re-Entry) Setup
RE Buy (Aqua Arrow):
Condition: Price is between the BB lower and middle bands, MAHI crossover, MALO crossover or MACD bullish, price above EMA 50, with additional confirmations (e.g., bullish engulfing or MACD bullish).
Interpretation: A re-entry buy signal after a pullback in an uptrend.
Action: Enter a long position if LTF and HTF confirm. Target the BB middle or upper band.
RE Sell (Fuchsia Arrow):
Condition: Price is between the BB upper and middle bands, MAHI crossunder, MALO crossunder or MACD bearish, price below EMA 50, with additional confirmations (e.g., bearish engulfing or MACD bearish).
Interpretation: A re-entry sell signal after a pullback in a downtrend.
Action: Enter a short position if LTF and HTF confirm. Target the BB middle or lower band.
5. MHV (Market High Volatility) Setup
MHV (Orange Label):
Condition: Follows a CSD signal, with expanding BB width, high ATR volatility, strong volume, and MAHI/MALO crossover or crossunder.
Interpretation: A breakout signal after consolidation, indicating high volatility and potential for a strong move.
Action: Trade in the direction of the breakout (e.g., buy if MAHI crossover, sell if MAHI crossunder). Confirm with LTF and HTF. Target significant levels like recent swing highs/lows.
6. Multi-Timeframe Confirmation
LTF Confirmation: A checkmark (✔) in the LTF row indicates the signal is also present on the lower timeframe (e.g., 5m). This adds confidence to the trade.
HTF Confirmation: A checkmark (✔) in the HTF row indicates alignment with the higher timeframe trend (e.g., 4h). This confirms the signal's strength.
Strongest Signals: Look for signals with both LTF and HTF confirmations (✔ in both rows). These have the highest probability of success.
7. Upcoming Signals
The CTF row in the subplot table may show "Upcoming" for a setup (e.g., EXT Buy: Upcoming). This indicates the setup is forming but not yet confirmed.
Action: Monitor these setups closely. They may turn "Active" on the next candle if conditions are met.
Trading Tips
Trend Alignment: Use the EMA 50 and market structure (is_uptrend) to ensure trades align with the overall trend. For example, prioritize CSM Buy signals in an uptrend.
Risk Management:
Set stop-losses below recent swing lows (for buys) or above recent swing highs (for sells).
Use the BB middle or opposite band as a target for most setups.
Avoid Overtrading: Focus on signals with LTF and HTF confirmations to filter out noise.
Timeframe Selection:
Scalping: Use 1m or 5m CTF with 1m LTF and 15m HTF.
Day Trading: Use 15m or 1h CTF with 5m LTF and 4h HTF.
Swing Trading: Use 4h or 1D CTF with 1h LTF and 1D HTF.
Backtesting: Test the indicator on historical data for your chosen asset and timeframe to understand its performance.
Alerts
The indicator includes built-in alerts for each setup:
EXT Buy/Sell: Triggers when an EXT signal is confirmed.
CSD: Triggers during consolidation.
CSM Buy/Sell: Triggers for continuation signals.
RE Buy/Sell: Triggers for re-entry signals.
MHV: Triggers for high volatility breakouts. To set up alerts:
Right-click on the chart and select "Add Alert."
Choose the condition (e.g., "BBMA EXT Buy").
Set your preferred notification method (e.g., email, SMS).
Limitations
Lagging Indicators: The indicator uses moving averages and other lagging tools, which may delay signals in fast-moving markets.
False Signals: Like all indicators, it can produce false signals, especially in choppy markets. Use LTF/HTF confirmations to filter trades.
Timeframe Dependency: Ensure your CTF, LTF, and HTF are properly aligned to avoid conflicting signals.
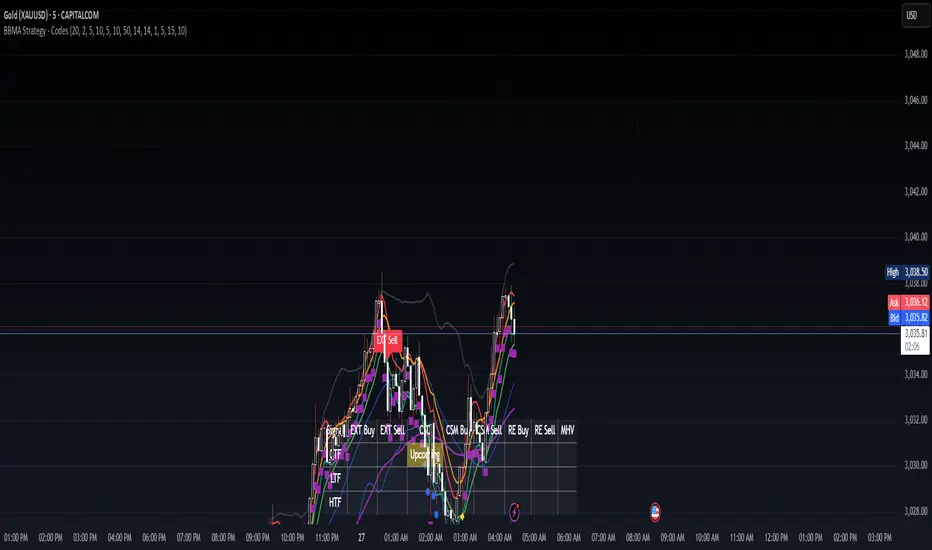
M Farm Scalper v4"M Farm Scalper v2" Trading Indicator on TradingView
Overview
This script uses a combination of indicators to help attempt the best view of when to exit and enter markets. The author has seen that usage of multiple indicators combined provided value and create profit.
1. Improved Signal Reliability
Combining swing highs and lows with Swing Failure Patterns (SFP) increases the reliability of the signals. Each indicator contributes different insights into market behavior:
Swing Highs and Lows: These help identify key support and resistance levels.
Swing Failure Patterns: These provide early warning signs of potential trend reversals when price fails to maintain new highs or lows.
2. Comprehensive Market Analysis
Using multiple indicators allows for a more comprehensive analysis of market conditions:
Trend Analysis: Swing highs and lows can indicate the overall trend direction.
Reversal Signals: SFPs highlight potential reversal points where the current trend might be weakening.
3. Enhanced Signal Strength
The script not only detects basic SFPs but also evaluates their strength by considering the number of failures within a specified range:
Strength of SFPs: By quantifying the strength of SFPs, the script can distinguish between weak and strong reversal signals. This helps traders prioritize stronger signals, reducing false positives.
4. Visual and Alert-based Trading
The combined use of these indicators improves both visual analysis and automated alert systems:
Visual Representation: Plotting different characters for swing points and SFPs makes it easier for traders to quickly interpret the chart.
Alerts: Automated alerts for specific conditions (like swing high/low failures) enable traders to respond promptly to significant market movements without constantly monitoring the charts.
5. Flexibility and Customization
The script includes parameters that allow traders to customize the behavior of the indicators based on their trading preferences:
Customization of Lookback Period (swingHistory): Traders can adjust this to fine-tune the sensitivity of swing point detection.
Selective Plotting (plotSwings, plotFirstSFPOnly, plotStrongerSFPs): These options provide flexibility in how much information is displayed on the chart, preventing clutter and focusing on relevant signals.
6. Minimized Noise and False Signals
By using a combination of indicators, the strategy aims to filter out market noise and reduce the likelihood of false signals:
Confluence of Signals: When multiple indicators align to provide a signal, it generally indicates a higher probability setup, thus reducing the chances of acting on false or less significant market moves.
7. Contextual Market Understanding
Combining indicators offers a more contextual understanding of market dynamics:
Market Context: Identifying both support/resistance levels (via swing points) and potential trend reversals (via SFPs) provides a fuller picture of market conditions, allowing traders to make more informed decisions.
Conclusion
Combining multiple indicators in the "M Farm Scalper v2" script is a strategic choice designed to enhance the robustness, reliability, and actionable quality of the trading signals. This approach leverages the strengths of each indicator to provide a well-rounded, comprehensive trading tool that aids traders in identifying high-probability trade setups and minimizing the risk of false signals.
ChatGPT can make mistakes. Check important info.
Introducing "M Farm Scalper v2" – an advanced proprietary trading indicator designed exclusively for the TradingView platform. This tool excels in identifying key swing points and Swing Failure Patterns (SFPs), offering traders unique visual and auditory cues to enhance decision-making. It's particularly tailored for the 5-minute timeframe but adaptable to suit a variety of trading styles.
Unique Features
Advanced Swing Point Detection: Leverages a sophisticated algorithm to detect swing highs and lows, integrating predictive analytics to forecast potential market reversals.
Dynamic Swing Failure Pattern Analysis: Employs a real-time analysis combining price action and volume data to pinpoint bullish and bearish reversal opportunities with high precision.
Innovative Visual and Auditory Cues: Features unique, easy-to-understand icons such as animals and fruits to represent market signals, simplifying complex market data into actionable insights.
Functionality
"M Farm Scalper v2" is crafted to deliver:
Configurable Parameters: Users can adjust settings including Swing History, visibility of swing points, and sensitivity for detecting stronger SFPs, making it highly customizable to fit individual trading strategies.
Clear, Actionable Outputs: Designed to offer straightforward visual signals directly on the trading chart, facilitating quick and effective decision-making.
Compliance and Originality
Original Integration of Features: This script combines several analytical techniques into a cohesive unit that surpasses the capabilities of existing open-source scripts in both originality and functionality.
Justification for Closed-Source: The proprietary nature of the algorithms and the unique method of data presentation are maintained as closed-source to protect the integrity and effectiveness of the tool, providing users with a reliable competitive advantage.
Application Instructions
To apply "M Farm Scalper v2," add it from the TradingView "Indicators" menu by searching for our script. Adjust the customizable settings as per your trading requirements and observe how the indicator’s outputs make market dynamics easy to interpret and act upon.
Chart Presentation
The accompanying chart is presented cleanly, focusing solely on the outputs of "M Farm Scalper v2." Each visual cue is annotated to demonstrate its relevance, ensuring that traders can easily understand and utilize the information provided without distraction.
Conclusion
"M Farm Scalper v2" is not just an indicator but an essential trading tool for those seeking precision and efficiency in their trading operations. Its advanced features and user-friendly design make it a valuable addition to any trader’s arsenal, especially for those involved in scalping and short-term trading.
Protected script
This script is published closed-source but you may use it freely. You can favorite it to use it on a chart. You cannot view or modify its source code.
Disclaimer
The information and publications are not meant to be, and do not constitute, financial, investment, trading, or other types of advice or recommendations supplied or endorsed by TradingView. Read more in the Terms of Use.

Dynamic Swing Anchored VWAP (Zeiierman)█ Overview
Dynamic Swing Anchored VWAP (Zeiierman) is a price–volume tool that anchors VWAP at fresh swing highs/lows and then adapts its responsiveness as conditions change. Instead of one static VWAP that drifts away over time, this indicator re-anchors at meaningful structure points (swings). It computes a decayed, volume-weighted average that can speed up in volatile markets and slow down during quiet periods.
Blending swing structure with an adaptive VWAP engine creates a fair-value path that stays aligned with current price behavior, making retests, pullbacks, and mean reversion opportunities easier to spot and trade.
█ How It Works
⚪ Swing Anchor Engine
The script scans for swing highs/lows using your Swing Period.
When market direction flips (new pivot confirmed), the indicator anchors a new VWAP at that pivot and starts tracking from there.
⚪ Adaptive VWAP Core
From each anchor , VWAP is computed using a decay model (recent price×volume matters more; older data matters less).
Adaptive Price Tracking lets you set the base responsiveness in “bars.” Lower = more reactive, higher = smoother.
Volatility Adjustment (ATR vs Avg ATR) can automatically speed up the VWAP during spikes and slow it during compression, so the line stays relevant to live conditions.
█ Why This Adaptive Approach Beats a Simple VWAP
Standard VWAP is cumulative from the anchor point. As time passes and volume accumulates, it often drifts far from current price, especially in prolonged trends or multi-session moves. That drift makes retests rare and unreliable.
Dynamic Swing Anchored VWAP solves this in two ways:
⚪ Event-Driven Anchoring (Swings):
By restarting at fresh swing highs/lows, the VWAP reference reflects today’s structure. You get frequent, meaningful retests because the anchor stays near the action.
⚪ Adaptive Responsiveness (Volatility-Aware):
Markets don’t move at one speed. When volatility expands, a fixed VWAP lags; when volatility contracts, it can overreact to noise. Here, the “tracking speed” can auto-adjust using ATR vs its average.
High Volatility → faster tracking: VWAP hugs price more tightly, preserving retest relevance.
Low Volatility → smoother tracking: VWAP filters chop and stays stable.
Result: A VWAP that follows price more accurately, creating plenty of credible retest opportunities and more trustworthy mean-reversion/continuation reads than a simple, ever-growing VWAP.
█ How to Use
⚪ S wing-Aware Fair Value
Use the VWAP as a dynamic fair-value guide that restarts at key structural pivots. Pullbacks to the VWAP after impulsive moves often provide retest entries.
⚪ Trend Trading
In trends, the adaptive VWAP will ride closer to price, offering continuation pullbacks.
█ Settings
Swing Period: Number of bars to confirm swing highs/lows. Larger = bigger, cleaner pivots (slower); smaller = more frequent pivots (noisier).
Adaptive Price Tracking: Sets the base reaction speed (in bars). Lower = faster, tighter to price; higher = smoother, slower.
Adapt APT by ATR ratio: When ON, the tracking speed auto-adjusts with market volatility (ATR vs its own average). High vol → faster; low vol → calmer.
Volatility Bias: Controls how strongly volatility affects the speed. >1 = stronger effect; <1 = lighter touch.
-----------------
Disclaimer
The content provided in my scripts, indicators, ideas, algorithms, and systems is for educational and informational purposes only. It does not constitute financial advice, investment recommendations, or a solicitation to buy or sell any financial instruments. I will not accept liability for any loss or damage, including without limitation any loss of profit, which may arise directly or indirectly from the use of or reliance on such information.
All investments involve risk, and the past performance of a security, industry, sector, market, financial product, trading strategy, backtest, or individual's trading does not guarantee future results or returns. Investors are fully responsible for any investment decisions they make. Such decisions should be based solely on an evaluation of their financial circumstances, investment objectives, risk tolerance, and liquidity needs.

Support & Resistance + EMA + Swing SL (3 Min)### **📌 Brief Description of the Script**
This **Pine Script indicator** for TradingView displays **Support & Resistance levels, EMAs (21 & 26), and Swing High/Low-based Stop-Loss (SL) points** on a **3-minute timeframe**.
---
### **🔹 Key Features & Functionality**
1️⃣ **🟥 Support & Resistance Calculation:**
- Finds the **highest & lowest price over the last 50 candles**
- Plots **Resistance (Red) & Support (Green) levels**
2️⃣ **📈 EMA (Exponential Moving Averages):**
- **21 EMA (Blue)** and **26 EMA (Orange)** for trend direction
- Helps in identifying bullish or bearish momentum
3️⃣ **📊 Swing High & Swing Low Detection:**
- Identifies **Swing Highs (Higher than last 5 candles) as SL for Short trades**
- Identifies **Swing Lows (Lower than last 5 candles) as SL for Long trades**
- Plots these levels as **Purple (Swing High SL) & Yellow (Swing Low SL) dotted lines**
4️⃣ **📌 Labels on Swing Points:**
- **"HH SL"** is placed on Swing Highs
- **"LL SL"** is placed on Swing Lows
5️⃣ **⚡ Breakout Detection:**
- Detects if **price crosses above Resistance** (Bullish Breakout)
- Detects if **price crosses below Support** (Bearish Breakout)
- Background color changes to **Green (Bullish)** or **Red (Bearish)**
6️⃣ **🚨 Alerts for Breakouts:**
- Sends alerts when **price breaks above Resistance or below Support**
---
### **🎯 How to Use This Indicator?**
- **Trade with Trend:** Follow **EMA crossovers** and Support/Resistance levels
- **Set Stop-Loss:** Use **Swing High as SL for Shorts** & **Swing Low as SL for Longs**
- **Look for Breakouts:** Enter trades when price **crosses Resistance or Support**
This script is **ideal for scalping & intraday trading** in a **3-minute timeframe** 🚀🔥
Let me know if you need **any modifications or improvements!** 📊💹

DTFX Algo Zones [SamuraiJack Mod]CME_MINI:NQ1!
Credits
This indicator is a modified version of an open-source tool originally developed by Lux Algo. I literally modded their indicator to create the DTFX Algo Zones version, incorporating additional features and refinements. Special thanks to Lux Algo for their original work and for providing the open-source code that made this development possible.
Introduction
DTFX Algo Zones is a technical analysis indicator designed to automatically identify key supply and demand zones on your chart using market structure and Fibonacci retracements. It helps traders spot high-probability reversal areas and important support/resistance levels at a glance. By detecting shifts in market structure (such as Break of Structure and Change of Character) and highlighting bullish or bearish zones dynamically, this tool provides an intuitive framework for planning trades. The goal is to save traders time and improve decision-making by focusing attention on the most critical price zones where market bias may confirm or reverse.
Logic & Features
• Market Structure Shift Detection (BOS & CHoCH): The indicator continuously monitors price swings and marks significant structure shifts. A Break of Structure (BOS) occurs when price breaks above a previous swing high or below a swing low, indicating a continuation of the current trend. A Change of Character (ChoCH) is detected when price breaks in the opposite direction of the prior trend, often signaling an early trend reversal. These moments are visually marked on the chart, serving as anchor points for new zones. By identifying BOS and ChoCH in real-time, the DTFX Algo Zones indicator ensures you’re aware of key trend changes as they happen.
• Auto-Drawn Fibonacci Supply/Demand Zones: Upon a valid structure shift, the indicator plots a Fibonacci-based zone between the breakout point and the preceding swing high/low (the source of the move). This creates a shaded area or band of Fibonacci retracement levels (for example 38.2%, 50%, 61.8%, etc.) representing a potential support zone in an uptrend or resistance zone in a downtrend. These supply/demand zones are derived from the natural retracement of the breakout move, highlighting where price is likely to pull back. Each zone is essentially an auto-generated Fibonacci retracement region tied to a market structure event, which traders can use to anticipate where the next pullback or bounce might occur.
• Dynamic Bullish and Bearish Zones: The DTFX Algo Zones indicator distinguishes bullish vs. bearish zones and updates them dynamically as new price action unfolds. Bullish zones (formed after bullish BOS/ChoCH) are typically highlighted in one color (e.g. green or blue) to indicate areas of demand/support where price may bounce upward. Bearish zones (formed after bearish BOS/ChoCH) are shown in another color (e.g. red/orange) to mark supply/resistance where price may stall or reverse downward. This color-coding and real-time updating allow traders to instantly recognize the market bias: for instance, a series of bullish zones implies an uptrend with multiple support levels on pullbacks, while consecutive bearish zones indicate a downtrend with resistance overhead. As old zones get invalidated or new ones appear, the chart remains current with the latest key levels, eliminating clutter from outdated levels.
• Flexible Customization: The indicator comes with several options to tailor the zones to your trading style. You can filter which zones to display – for example, show only the most recent N zones or limit to only bullish or only bearish zones – helping declutter the chart and focus on recent, relevant levels. There are settings to control zone extension (how far into the future the zones are drawn) and to automatically invalidate zones once they’re no longer relevant (for instance, if price fully breaks through a zone or a new structure shift occurs that supersedes it). Additionally, the Fibonacci retracement levels within each zone are customizable: you can choose which retracement percentages to plot, adjust their colors or line styles, and decide whether to fill the zone area for visibility. This flexibility ensures the DTFX Algo Zones can be tuned for different markets and strategies, whether you want a clean minimalist look or detailed zones with multiple internal levels.
Best Use Cases
DTFX Algo Zones is a versatile indicator that can enhance various trading strategies. Some of its best use cases include:
• Identifying High-Probability Reversal Zones: Each zone marks an area where price has a higher likelihood of stalling or reversing because it reflects a significant prior swing and Fibonacci retracement. Traders can watch these zones for entry opportunities when the market approaches them, as they often coincide with order block or strong supply/demand areas. This is especially useful for catching trend reversals or pullbacks at points where risk is lower and potential reward is higher.
• Spotting Key Support and Resistance: The automatically drawn zones act as dynamic support (below price) and resistance (above price) levels. Instead of manually drawing Fibonacci retracements or support/resistance lines, you get an instant map of the key levels derived from recent price action. This helps in quickly identifying where the next bounce (support) or rejection (resistance) might occur. Swing traders and intraday traders alike can use these zones to set alerts or anticipate reaction areas as the market moves.
• Trend-Following Entries: In a trending market, the indicator’s zones provide ideal areas to join the trend on pullbacks. For example, in an uptrend, when a new bullish zone is drawn after a BOS, it indicates a fresh demand zone – buying near the lower end of that zone on a pullback can offer a low-risk entry to ride the next leg up. Similarly, in a downtrend, selling rallies into the highlighted supply zones can position you in the direction of the prevailing trend. The zones effectively serve as a roadmap of the trend’s structure, allowing trend traders to buy dips and sell rallies with greater confidence.
• Mean-Reversion and Range Trading: Even in choppy or range-bound markets, DTFX Algo Zones can help find mean-reversion trades. If price is oscillating sideways, the zones at extremes of the range might mark where momentum is shifting (ChoCH) and price could swing back toward the mean. A trader might fade an extended move when it reaches a strong zone, anticipating a reversion. Additionally, if multiple zones cluster in an area across time (creating a zone overlap), it often signifies a particularly robust support/resistance level ideal for range trading strategies.
In all these use cases, the indicator’s ability to filter out noise and highlight structurally important levels means traders can focus on higher-probability setups and make more informed trading decisions.
Strategy – Pullback Trading with DTFX Algo Zones
One of the most effective ways to use the DTFX Algo Zones indicator is trading pullbacks in the direction of the trend. Below is a step-by-step strategy to capitalize on pullbacks using the zones, combining the indicator’s signals with sound price action analysis and risk management:
1. Identify a Market Structure Shift and Trend Bias: First, observe the chart for a recent BOS or ChoCH signal from the indicator. This will tell you the current trend bias. For instance, a bullish BOS/ChoCH means the market momentum has shifted upward (bullish bias), and a new demand zone will be drawn. A bearish structure break indicates downward momentum and creates a supply zone. Make sure the broader context supports the bias (e.g., if multiple higher timeframe zones are bullish, focus on long trades).
2. Wait for the Pullback into the Zone: Once a new zone appears, don’t chase the price immediately. Instead, wait for price to retrace back into that highlighted zone. Patience is key – let the market come to you. For a bullish setup, allow price to dip into the Fibonacci retracement zone (demand area); for a bearish setup, watch for a rally into the supply zone. Often, the middle of the zone (around the 50% retracement level) can be an optimal area where price might slow down and pivot, but it’s wise to observe price behavior across the entire zone.
3. Confirm the Entry with Price Action & Confluence: As price tests the zone, look for confirmation signals before entering the trade. This can include bullish reversal candlestick patterns (for longs) or bearish patterns (for shorts) such as engulfing candles, hammers/shooting stars, or doji indicating indecision turning to reversal. Additionally, incorporate confluence factors to strengthen the setup: for example, check if the zone overlaps with a key moving average, a round number price level, or an old support/resistance line from a higher timeframe. You might also use an oscillator (like RSI or Stochastic) to see if the pullback has reached oversold conditions in a bullish zone (or overbought in a bearish zone), suggesting a bounce is likely. The more factors aligning at the zone, the more confidence you can have in the trade. Only proceed with an entry once you see clear evidence of buyers defending a demand zone or sellers defending a supply zone.
4. Enter the Trade and Manage Risk: When you’re satisfied with the confirmation (e.g., price starts to react positively off a demand zone or shows rejection wicks in a supply zone), execute your entry in the direction of the original trend. Immediately set a stop-loss order to control risk: for a long trade, a common placement is just below the demand zone (a few ticks/pips under the swing low that formed the zone); for a short trade, place the stop just above the supply zone’s high. This way, if the zone fails and price continues beyond it, your loss is limited. Position size the trade so that this stop-loss distance corresponds to a risk you are comfortable with (for example, 1-2% of your trading capital).
5. Take Profit Strategically: Plan your take-profit targets in advance. A conservative approach is to target the origin of the move – for instance, in a long trade, you might take profit as price moves back up to the swing high (the 0% Fibonacci level of the zone) or the next significant zone or resistance level above. This often yields at least a 1:1 reward-to-risk ratio if you entered around mid-zone. More aggressive trend-following traders may leave a portion of the position running beyond the initial target, aiming for a larger move in line with the trend (for example, new higher highs in an uptrend). You can also trail your stop-loss upward behind new higher lows (for longs) or lower highs (for shorts) as the trend progresses, locking in profit while allowing for further gains.
6. Monitor Zone Invalidation: Even after entering, keep an eye on the behavior around the zone and any new zones that may form. If price fails to bounce and instead breaks decisively through the entire zone, respect that as an invalidation – the market may be signaling a deeper reversal or that the signal was false. In such a case, it’s better to exit early or stick to your stop-loss than to hold onto a losing position. The indicator will often mark or no longer highlight zones that have been invalidated by price, guiding you to shift focus to the next opportunity.
Risk Management Tips:
• Always use a stop-loss and don’t move it farther out in hope. Placing the stop just beyond the zone’s far end (the swing point) helps protect you if the pullback turns into a larger reversal.
• Aim for a favorable risk-to-reward ratio. With pullback entries near the middle or far end of a zone, you can often achieve a reward that equals or exceeds your risk. For example, risking 20 pips to make 20+ pips (1:1 or better) is a prudent starting point. Adjust targets based on market structure – if the next resistance is 50 pips away, consider that upside against your risk.
• Use confluence and context: Don’t take every zone signal in isolation. The highest probability trades come when the DTFX Algo Zone aligns with other analysis (trend direction, chart patterns, higher timeframe support/resistance, etc.). This filtered approach will reduce trades taken in weak zones or counter-trend traps.
• Embrace patience and selectivity: Not all zones are equal. It can be wise to skip very narrow or insignificant zones and wait for those that form after a strong BOS/ChoCH (indicating a powerful move). Larger zones or zones formed during high-volume times tend to produce more reliable pullback opportunities.
• Review and adapt: After each trade, note how price behaved around the zone. If you notice certain Fib levels (like 50% or 61.8%) within the zone consistently provide the best entries, you can refine your approach to focus on those. Similarly, adjust the indicator’s settings if needed – for example, if too many minor zones are cluttering your screen, limit to the last few or increase the structure length parameter to capture only more significant swings.
⸻
By combining the DTFX Algo Zones indicator with disciplined confirmation and risk management, traders can improve their timing on pullback entries and avoid chasing moves. This indicator shines in helping you trade what you see, not what you feel – the clearly marked zones and structure shifts keep you grounded in price action reality. Whether you’re a trend trader looking to buy the dip/sell the rally, or a reversal trader hunting for exhaustion points, DTFX Algo Zones provides a robust visual aid to elevate your trading decisions. Use it as a complementary tool in your analysis to stay on the right side of the market’s structure and enhance your trading performance.

Quantify [Entry Model] | FractalystWhat’s the indicator’s purpose and functionality?
Quantify is a machine learning entry model designed to help traders identify high-probability setups to refine their strategies.
➙ Simply pick your bias, select your entry timeframes, and let Quantify handle the rest for you.
Can the indicator be applied to any market approach/trading strategy?
Absolutely, all trading strategies share one fundamental element: Directional Bias
Once you’ve determined the market bias using your own personal approach, whether it’s through technical analysis or fundamental analysis, select the trend direction in the Quantify user inputs.
The algorithm will then adjust its calculations to provide optimal entry levels aligned with your chosen bias. This involves analyzing historical patterns to identify setups with the highest potential expected values, ensuring your setups are aligned with the selected direction.
Can the indicator be used for different timeframes or trading styles?
Yes, regardless of the timeframe you’d like to take your entries, the indicator adapts to your trading style.
Whether you’re a swing trader, scalper, or even a position trader, the algorithm dynamically evaluates market conditions across your chosen timeframe.
How can this indicator help me to refine my trading strategy?
1. Focus on Positive Expected Value
• The indicator evaluates every setup to ensure it has a positive expected value, helping you focus only on trades that statistically favor long-term profitability.
2. Adapt to Market Conditions
• By analyzing real-time market behavior and historical patterns, the algorithm adjusts its calculations to match current conditions, keeping your strategy relevant and adaptable.
3. Eliminate Emotional Bias
• With clear probabilities, expected values, and data-driven insights, the indicator removes guesswork and helps you avoid emotional decisions that can damage your edge.
4. Optimize Entry Levels
• The indicator identifies optimal entry levels based on your selected bias and timeframes, improving robustness in your trades.
5. Enhance Risk Management
• Using tools like the Kelly Criterion, the indicator suggests optimal position sizes and risk levels, ensuring that your strategy maintains consistency and discipline.
6. Avoid Overtrading
• By highlighting only high-potential setups, the indicator keeps you focused on quality over quantity, helping you refine your strategy and avoid unnecessary losses.
How can I get started to use the indicator for my entries?
1. Set Your Market Bias
• Determine whether the market trend is Bullish or Bearish using your own approach.
• Select the corresponding bias in the indicator’s user inputs to align it with your analysis.
2. Choose Your Entry Timeframes
• Specify the timeframes you want to focus on for trade entries.
• The indicator will dynamically analyze these timeframes to provide optimal setups.
3. Let the Algorithm Analyze
• Quantify evaluates historical data and real-time price action to calculate probabilities and expected values.
• It highlights setups with the highest potential based on your selected bias and timeframes.
4. Refine Your Entries
• Use the insights provided—entry levels, probabilities, and risk calculations—to align your trades with a math-driven edge.
• Avoid overtrading by focusing only on setups with positive expected value.
5. Adapt to Market Conditions
• The indicator continuously adapts to real-time market behavior, ensuring its recommendations stay relevant and precise as conditions change.
How does the indicator calculate the current range?
The indicator calculates the current range by analyzing swing points from the very first bar on your charts to the latest available bar it identifies external liquidity levels, also known as BSLQ (buy-side liquidity levels) and SSLQ (sell-side liquidity levels).
What's the purpose of these levels? What are the underlying calculations?
1. Understanding Swing highs and Swing Lows
Swing High: A Swing High is formed when there is a high with 2 lower highs to the left and right.
Swing Low: A Swing Low is formed when there is a low with 2 higher lows to the left and right.
2. Understanding the purpose and the underlying calculations behind Buyside, Sellside and Pivot levels.
3. Identifying Discount and Premium Zones.
4. Importance of Risk-Reward in Premium and Discount Ranges
How does the script calculate probabilities?
The script calculates the probability of each liquidity level individually. Here's the breakdown:
1. Upon the formation of a new range, the script waits for the price to reach and tap into pivot level level. Status: "■" - Inactive
2. Once pivot level is tapped into, the pivot status becomes activated and it waits for either liquidity side to be hit. Status: "▶" - Active
3. If the buyside liquidity is hit, the script adds to the count of successful buyside liquidity occurrences. Similarly, if the sellside is tapped, it records successful sellside liquidity occurrences.
4. Finally, the number of successful occurrences for each side is divided by the overall count individually to calculate the range probabilities.
Note: The calculations are performed independently for each directional range. A range is considered bearish if the previous breakout was through a sellside liquidity. Conversely, a range is considered bullish if the most recent breakout was through a buyside liquidity.
What does the multi-timeframe functionality offer?
You can incorporate up to 4 higher timeframe probabilities directly into the table.
This feature allows you to analyze the probabilities of buyside and sellside liquidity across multiple timeframes, without the need to manually switch between them.
By viewing these higher timeframe probabilities in one place, traders can spot larger market trends and refine their entries and exits with a better understanding of the overall market context.
What are the multi-timeframe underlying calculations?
The script uses the same calculations (mentioned above) and uses security function to request the data such as price levels, bar time, probabilities and booleans from the user-input timeframe.
How does the Indicator Identifies Positive Expected Values?
Quantify instantly calculates whether a trade setup has the potential to generate positive expected value (EV).
To determine a positive EV setup, the indicator uses the formula:
EV = ( P(Win) × R(Win) ) − ( P(Loss) × R(Loss))
where:
- P(Win) is the probability of a winning trade.
- R(Win) is the reward or return for a winning trade, determined by the current risk-to-reward ratio (RR).
- P(Loss) is the probability of a losing trade.
- R(Loss) is the loss incurred per losing trade, typically assumed to be -1.
By calculating these values based on historical data and the current trading setup, the indicator helps you understand whether your trade has a positive expected value.
How can I know that the setup I'm going to trade with has a positive EV?
If the indicator detects that the adjusted pivot and buy/sell side probabilities have generated positive expected value (EV) in historical data, the risk-to-reward (RR) label within the range box will be colored blue and red .
If the setup does not produce positive EV, the RR label will appear gray.
This indicates that even the risk-to-reward ratio is greater than 1:1, the setup is not likely to yield a positive EV because, according to historical data, the number of losses outweighs the number of wins relative to the RR gain per winning trade.
What is the confidence level in the indicator, and how is it determined?
The confidence level in the indicator reflects the reliability of the probabilities calculated based on historical data. It is determined by the sample size of the probabilities used in the calculations. A larger sample size generally increases the confidence level, indicating that the probabilities are more reliable and consistent with past performance.
How does the confidence level affect the risk-to-reward (RR) label?
The confidence level (★) is visually represented alongside the probability label. A higher confidence level indicates that the probabilities used to determine the RR label are based on a larger and more reliable sample size.
How can traders use the confidence level to make better trading decisions?
Traders can use the confidence level to gauge the reliability of the probabilities and expected value (EV) calculations provided by the indicator. A confidence level above 95% is considered statistically significant and indicates that the historical data supporting the probabilities is robust. This high confidence level suggests that the probabilities are reliable and that the indicator’s recommendations are more likely to be accurate.
In data science and statistics, a confidence level above 95% generally means that there is less than a 5% chance that the observed results are due to random variation. This threshold is widely accepted in research and industry as a marker of statistical significance. Studies such as those published in the Journal of Statistical Software and the American Statistical Association support this threshold, emphasizing that a confidence level above 95% provides a strong assurance of data reliability and validity.
Conversely, a confidence level below 95% indicates that the sample size may be insufficient and that the data might be less reliable. In such cases, traders should approach the indicator’s recommendations with caution and consider additional factors or further analysis before making trading decisions.
How does the sample size affect the confidence level, and how does it relate to my TradingView plan?
The sample size for calculating the confidence level is directly influenced by the amount of historical data available on your charts. A larger sample size typically leads to more reliable probabilities and higher confidence levels.
Here’s how the TradingView plans affect your data access:
Essential Plan
The Essential Plan provides basic data access with a limited amount of historical data. This can lead to smaller sample sizes and lower confidence levels, which may weaken the robustness of your probability calculations. Suitable for casual traders who do not require extensive historical analysis.
Plus Plan
The Plus Plan offers more historical data than the Essential Plan, allowing for larger sample sizes and more accurate confidence levels. This enhancement improves the reliability of indicator calculations. This plan is ideal for more active traders looking to refine their strategies with better data.
Premium Plan
The Premium Plan grants access to extensive historical data, enabling the largest sample sizes and the highest confidence levels. This plan provides the most reliable data for accurate calculations, with up to 20,000 historical bars available for analysis. It is designed for serious traders who need comprehensive data for in-depth market analysis.
PRO+ Plans
The PRO+ Plans offer the most extensive historical data, allowing for the largest sample sizes and the highest confidence levels. These plans are tailored for professional traders who require advanced features and significant historical data to support their trading strategies effectively.
For many traders, the Premium Plan offers a good balance of affordability and sufficient sample size for accurate confidence levels.
What is the HTF probability table and how does it work?
The HTF (Higher Time Frame) probability table is a feature that allows you to view buy and sellside probabilities and their status from timeframes higher than your current chart timeframe.
Here’s how it works:
Data Request: The table requests and retrieves data from user-defined higher timeframes (HTFs) that you select.
Probability Display: It displays the buy and sellside probabilities for each of these HTFs, providing insights into the likelihood of price movements based on higher timeframe data.
Detailed Tooltips: The table includes detailed tooltips for each timeframe, offering additional context and explanations to help you understand the data better.
What do the different colors in the HTF probability table indicate?
The colors in the HTF probability table provide visual cues about the expected value (EV) of trading setups based on higher timeframe probabilities:
Blue: Suggests that entering a long position from the HTF user-defined pivot point, targeting buyside liquidity, is likely to result in a positive expected value (EV) based on historical data and sample size.
Red: Indicates that entering a short position from the HTF user-defined pivot point, targeting sellside liquidity, is likely to result in a positive expected value (EV) based on historical data and sample size.
Gray: Shows that neither long nor short trades from the HTF user-defined pivot point are expected to generate positive EV, suggesting that trading these setups may not be favorable.
What machine learning techniques are used in Quantify?
Quantify offers two main machine learning approaches:
1. Adaptive Learning (Fixed Sample Size): The algorithm learns from the entire dataset without resampling, maintaining a stable model that adapts to the latest market conditions.
2. Bootstrap Resampling: This method creates multiple subsets of the historical data, allowing the model to train on varying sample sizes. This technique enhances the robustness of predictions by ensuring that the model is not overfitting to a single dataset.
How does machine learning affect the expected value calculations in Quantify?
Machine learning plays a key role in improving the accuracy of expected value (EV) calculations. By analyzing historical price action, liquidity hits, and market bias patterns, the model continuously adjusts its understanding of risk and reward, allowing the expected value to reflect the most likely market movements. This results in more precise EV predictions, helping traders focus on setups that maximize profitability.
What is the Kelly Criterion, and how does it work in Quantify?
The Kelly Criterion is a mathematical formula used to determine the optimal position size for each trade, maximizing long-term growth while minimizing the risk of large drawdowns. It calculates the percentage of your portfolio to risk on a trade based on the probability of winning and the expected payoff.
Quantify integrates this with user-defined inputs to dynamically calculate the most effective position size in percentage, aligning with the trader’s risk tolerance and desired exposure.
How does Quantify use the Kelly Criterion in practice?
Quantify uses the Kelly Criterion to optimize position sizing based on the following factors:
1. Confidence Level: The model assesses the confidence level in the trade setup based on historical data and sample size. A higher confidence level increases the suggested position size because the trade has a higher probability of success.
2. Max Allowed Drawdown (User-Defined): Traders can set their preferred maximum allowed drawdown, which dictates how much loss is acceptable before reducing position size or stopping trading. Quantify uses this input to ensure that risk exposure aligns with the trader’s risk tolerance.
3. Probabilities: Quantify calculates the probabilities of success for each trade setup. The higher the probability of a successful trade (based on historical price action and liquidity levels), the larger the position size suggested by the Kelly Criterion.
What is a trailing stoploss, and how does it work in Quantify?
A trailing stoploss is a dynamic risk management tool that moves with the price as the market trend continues in the trader’s favor. Unlike a fixed take profit, which stays at a set level, the trailing stoploss automatically adjusts itself as the market moves, locking in profits as the price advances.
In Quantify, the trailing stoploss is enhanced by incorporating market structure liquidity levels (explain above). This ensures that the stoploss adjusts intelligently based on key price levels, allowing the trader to stay in the trade as long as the trend remains intact, while also protecting profits if the market reverses.
Why would a trader prefer a trailing stoploss based on liquidity levels instead of a fixed take-profit level?
Traders who use trailing stoplosses based on liquidity levels prefer this method because:
1. Market-Driven Flexibility: The stoploss follows the market structure rather than being static at a pre-defined level. This means the stoploss is less likely to be hit by small market fluctuations or false reversals. The stoploss remains adaptive, moving as the market moves.
2. Riding the Trend: Traders can capture more profit during a sustained trend because the trailing stop will adjust only when the trend starts to reverse significantly, based on key liquidity levels. This allows them to hold positions longer without prematurely locking in profits.
3. Avoiding Premature Exits: Fixed stoploss levels may exit a trade too early in volatile markets, while liquidity-based trailing stoploss levels respect the natural flow of price action, preventing the trader from exiting too soon during pullbacks or minor retracements.
🎲 Becoming the House: Gaining an Edge Over the Market
In American roulette, the casino has a 5.26% edge due to the presence of the 0 and 00 pockets. On even-money bets, players face a 47.37% chance of winning, while true 50/50 odds would require a 50% chance. This edge—the gap between the payout odds and the true probabilities—ensures that, statistically, the casino will always win over time, even if individual players win occasionally.
From a Trader’s Perspective
In trading, your edge comes from identifying and executing setups with a positive expected value (EV). For example:
• If you identify a setup with a 55.48% chance of winning and a 1:1 risk-to-reward (RR) ratio, your trade has a statistical advantage over a neutral (50/50) probability.
This edge works in your favor when applied consistently across a series of trades, just as the casino’s edge ensures profitability across thousands of spins.
🎰 Applying the Concept to Trading
Like casinos leverage their mathematical edge in games of chance, you can achieve long-term success in trading by focusing on setups with positive EV and managing your trades systematically. Here’s how:
1. Probability Advantage: Prioritize trades where the probability of success (win rate) exceeds the breakeven rate for your chosen risk-to-reward ratio.
• Example: With a 1:1 RR, you need a win rate above 50% to achieve positive EV.
2. Risk-to-Reward Ratio (RR): Even with a win rate below 50%, you can gain an edge by increasing your RR (e.g., a 40% win rate with a 2:1 RR still has positive EV).
3. Consistency and Discipline: Just as casinos profit by sticking to their mathematical advantage over thousands of spins, traders must rely on their edge across many trades, avoiding emotional decisions or overleveraging.
By targeting favorable probabilities and managing trades effectively, you “become the house” in your trading. This approach allows you to leverage statistical advantages to enhance your overall performance and achieve sustainable profitability.
What Makes the Quantify Indicator Original?
1. Data-Driven Edge
Unlike traditional indicators that rely on static formulas, Quantify leverages probability-based analysis and machine learning. It calculates expected value (EV) and confidence levels to help traders identify setups with a true statistical edge.
2. Integration of Market Structure
Quantify uses market structure liquidity levels to dynamically adapt. It identifies key zones like swing highs/lows and liquidity traps, enabling users to align entries and exits with where the market is most likely to react. This bridges the gap between price action analysis and quantitative trading.
3. Sophisticated Risk Management
The Kelly Criterion implementation is unique. Quantify allows traders to input their maximum allowed drawdown, dynamically adjusting risk exposure to maintain optimal position sizing. This ensures risk is scientifically controlled while maximizing potential growth.
4. Multi-Timeframe and Liquidity-Based Trailing Stops
The indicator doesn’t just suggest fixed profit-taking levels. It offers market structure-based trailing stop-loss functionality, letting traders ride trends as long as liquidity and probabilities favor the position, which is rare in most tools.
5. Customizable Bias and Adaptive Learning
• Directional Bias: Traders can set a bullish or bearish bias, and the indicator recalculates probabilities to align with the trader’s market outlook.
• Adaptive Learning: The machine learning model adapts to changes in data (via resampling or bootstrap methods), ensuring that predictions stay relevant in evolving markets.
6. Positive EV Focus
The focus on positive EV setups differentiates it from reactive indicators. It shifts trading from chasing signals to acting on setups that statistically favor profitability, akin to how professional quant funds operate.
7. User Empowerment
Through features like customizable timeframes, real-time probability updates, and visualization tools, Quantify empowers users to make data-informed decisions.
Terms and Conditions | Disclaimer
Our charting tools are provided for informational and educational purposes only and should not be construed as financial, investment, or trading advice. They are not intended to forecast market movements or offer specific recommendations. Users should understand that past performance does not guarantee future results and should not base financial decisions solely on historical data.
Built-in components, features, and functionalities of our charting tools are the intellectual property of @Fractalyst use, reproduction, or distribution of these proprietary elements is prohibited.
By continuing to use our charting tools, the user acknowledges and accepts the Terms and Conditions outlined in this legal disclaimer and agrees to respect our intellectual property rights and comply with all applicable laws and regulations.
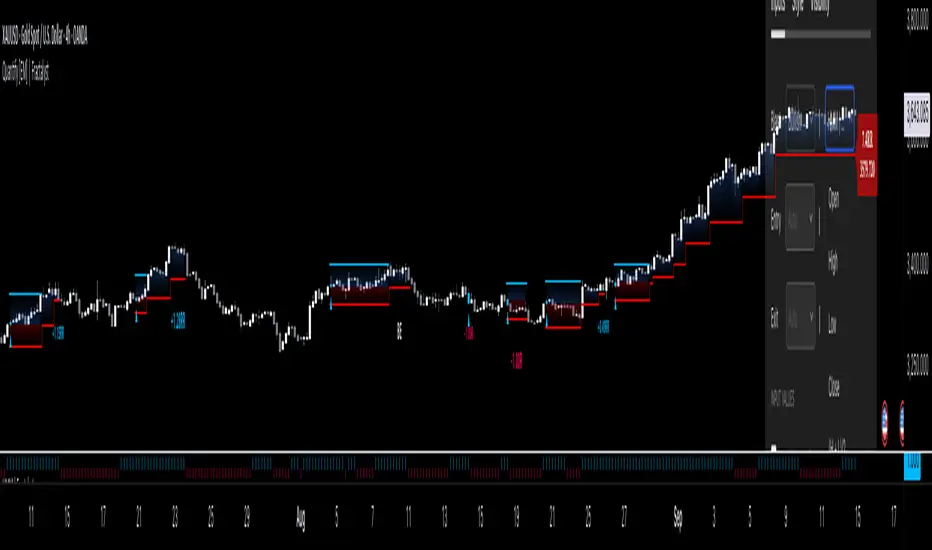
Reversal Zones with SignalsThe "Reversal Zones with Signals" indicator is an advanced technical analysis tool designed to help traders identify potential market reversal points. By integrating Relative Strength Index (RSI), moving averages, and swing high/low detection, this indicator provides traders with clear visual cues for potential buy and sell opportunities.
Key Features and Benefits
Integration of Multiple Technical Analysis Tools:
The indicator seamlessly combines RSI, moving averages, and swing high/low detection. This multi-faceted approach enhances the reliability of the signals by confirming potential reversals through different technical analysis perspectives.
Customizable Parameters:
Users can adjust the sensitivity of the moving averages, the RSI overbought and oversold levels, and the length of the reversal zones. This flexibility allows traders to tailor the indicator to fit their specific trading strategies and market conditions.
Clear Visual Signals:
Buy and sell signals are plotted directly on the chart as easily recognizable green and red labels. This visual clarity simplifies the process of identifying potential entry and exit points, enabling traders to act quickly and decisively.
Reversal Zones:
The indicator plots reversal zones based on swing highs and lows in conjunction with RSI conditions. Green lines represent potential support levels (zone bottoms), while red lines represent potential resistance levels (zone tops). These zones provide traders with clear areas where price reversals are likely to occur.
Automated Alerts:
Custom alerts can be set for both buy and sell signals, providing real-time notifications when potential trading opportunities arise. This feature ensures that traders do not miss critical market moves.
How It Works
RSI Calculation:
The Relative Strength Index (RSI) is calculated to determine overbought and oversold conditions. When RSI exceeds the overbought threshold, it indicates that the market may be overbought, and when it falls below the oversold threshold, it indicates that the market may be oversold. This helps in identifying potential reversal points.
Swing High/Low Detection:
Swing highs and lows are detected using a specified lookback period. These points represent significant price levels where reversals are likely to occur. Swing highs are detected using the ta.pivothigh function, and swing lows are detected using the ta.pivotlow function.
Reversal Zones:
Reversal zones are defined by plotting lines at swing high and low levels when RSI conditions are met. These zones serve as visual cues for potential support and resistance areas, providing a structured framework for identifying reversal points.
Buy and Sell Signals:
Buy signals are generated when the price crosses above a defined reversal zone bottom, indicating a potential upward reversal. Sell signals are generated when the price crosses below a defined reversal zone top, indicating a potential downward reversal. These signals are further confirmed by the presence of bullish or bearish engulfing patterns.
Plotting and Alerts:
The indicator plots buy and sell signals directly on the chart with corresponding labels. Additionally, alerts can be set up to notify the user when a signal is generated, ensuring timely action.
Originality and Usefulness
Innovative Integration of Technical Tools:
The "Reversal Zones with Signals" indicator uniquely combines multiple technical analysis tools into a single, cohesive indicator. This integration provides a comprehensive view of market conditions, enhancing the accuracy of the signals and offering a robust tool for traders.
Enhanced Trading Decisions:
By providing clear and actionable signals, the indicator helps traders make better-informed decisions. The visualization of reversal zones and the integration of RSI and moving averages ensure that traders have a solid framework for identifying potential reversals.
Flexibility and Customization:
The customizable parameters allow traders to adapt the indicator to different trading styles and market conditions. This flexibility ensures that the indicator can be used effectively by a wide range of traders, from beginners to advanced professionals.
Clear and User-Friendly Interface:
The indicator's design prioritizes ease of use, with clear visual signals and intuitive settings. This user-friendly approach makes it accessible to traders of all experience levels.
Real-Time Alerts:
The ability to set up custom alerts ensures that traders are notified of potential trading opportunities as they arise, helping them to act quickly and efficiently.
Versatility Across Markets:
The indicator is suitable for use in various financial markets, including stocks, forex, and cryptocurrencies. Its adaptability across different asset classes makes it a valuable addition to any trader's toolkit.
How to Use
Adding the Indicator:
Add the "Reversal Zones with Signals" indicator to your chart.
Adjust the parameters (Sensitivity, RSI OverBought Value, RSI OverSold Value, Zone Length) to match your trading strategy and market conditions.
Interpreting Signals:
Buy Signal: A green "BUY" label appears below a bar, indicating a potential buying opportunity based on the detected reversal zone and price action.
Sell Signal: A red "SELL" label appears above a bar, indicating a potential selling opportunity based on the detected reversal zone and price action.
Setting Alerts:
Set alerts for buy and sell signals to receive notifications when potential trading opportunities arise. This ensures timely action and helps traders stay informed about critical market moves.

ICT Concepts [LuxAlgo]The ICT Concepts indicator regroups core concepts highlighted by trader and educator "The Inner Circle Trader" (ICT) into an all-in-one toolkit. Features include Market Structure (MSS & BOS), Order Blocks, Imbalances, Buyside/Sellside Liquidity, Displacements, ICT Killzones, and New Week/Day Opening Gaps.
🔶 SETTINGS
🔹 Mode
When Present is selected, only data of the latest 500 bars are used/visualized, except for NWOG/NDOG
🔹 Market Structure
Enable/disable Market Structure.
Length: will set the lookback period/sensitivity.
In Present Mode only the latest Market Structure trend will be shown, while in Historical Mode, previous trends will be shown as well:
You can toggle MSS/BOS separately and change the colors:
🔹 Displacement
Enable/disable Displacement.
🔹 Volume Imbalance
Enable/disable Volume Imbalance.
# Visible VI's: sets the amount of visible Volume Imbalances (max 100), color setting is placed at the side.
🔹 Order Blocks
Enable/disable Order Blocks.
Swing Lookback: Lookback period used for the detection of the swing points used to create order blocks.
Show Last Bullish OB: Number of the most recent bullish order/breaker blocks to display on the chart.
Show Last Bearish OB: Number of the most recent bearish order/breaker blocks to display on the chart.
Color settings.
Show Historical Polarity Changes: Allows users to see labels indicating where a swing high/low previously occurred within a breaker block.
Use Candle Body: Allows users to use candle bodies as order block areas instead of the full candle range.
Change in Order Blocks style:
🔹 Liquidity
Enable/disable Liquidity.
Margin: sets the sensitivity, 2 points are fairly equal when:
'point 1' < 'point 2' + (10 bar Average True Range / (10 / margin)) and
'point 1' > 'point 2' - (10 bar Average True Range / (10 / margin))
# Visible Liq. boxes: sets the amount of visible Liquidity boxes (max 50), this amount is for Sellside and Buyside boxes separately.
Colour settings.
Change in Liquidity style:
🔹 Fair Value Gaps
Enable/disable FVG's.
Balance Price Range: this is the overlap of latest bullish and bearish Fair Value Gaps.
By disabling Balance Price Range only FVGs will be shown.
Options: Choose whether you wish to see FVG or Implied Fair Value Gaps (this will impact Balance Price Range as well)
# Visible FVG's: sets the amount of visible FVG's (max 20, in the same direction).
Color settings.
Change in FVG style:
🔹 NWOG/NDOG
Enable/disable NWOG; color settings; amount of NWOG shown (max 50).
Enable/disable NDOG ; color settings; amount of NDOG shown (max 50).
🔹 Fibonacci
This tool connects the 2 most recent bullish/bearish (if applicable) features of your choice, provided they are enabled.
3 examples (FVG, BPR, OB):
Extend lines -> Enabled (example OB):
🔹 Killzones
Enable/disable all or the ones you need.
Time settings are coded in the corresponding time zones.
🔶 USAGE
By default, the indicator displays each feature relevant to the most recent price variations in order to avoid clutter on the chart & to provide a very similar experience to how a user would contruct ICT Concepts by hand.
Users can use the historical mode in the settings to see historical market structure/imbalances. The ICT Concepts indicator has various use cases, below we outline many examples of how a trader could find usage of the features together.
In the above image we can see price took out Sellside liquidity, filled two bearish FVGs, a market structure shift, which then led to a clean retest of a bullish FVG as a clean setup to target the order block above.
Price then fills the OB which creates a breaker level as seen in yellow.
Broken OBs can be useful for a trader using the ICT Concepts indicator as it marks a level where orders have now been filled, indicating a solidified level that has proved itself as an area of liquidity. In the image above we can see a trade setup using a broken bearish OB as a potential entry level.
We can see the New Week Opening Gap (NWOG) above was an optimal level to target considering price may tend to fill / react off of these levels according to ICT.
In the next image above, we have another example of various use cases where the ICT Concepts indicator hypothetically allow traders to find key levels & find optimal entry points using market structure.
In the image above we can see a bearish Market Structure Shift (MSS) is confirmed, indicating a potential trade setup for targeting the Balanced Price Range imbalance (BPR) below with a stop loss above the buyside liquidity.
Although what we are demonstrating here is a hindsight example, it shows the potential usage this toolkit gives you for creating trading plans based on ICT Concepts.
Same chart but playing out the history further we can see directly after price came down to the Sellside liquidity & swept below it...
Then by enabling IFVGs in the settings, we can see the IFVG retests alongside the Sellside & Buyside liquidity acting in confluence.
Which allows us to see a great bullish structure in the market with various key levels for potential entries.
Here we can see a potential bullish setup as price has taken out a previous Sellside liquidity zone and is now retesting a NWOG + Volume Imbalance.
Users also have the option to display Fibonacci retracements based on market structure, order blocks, and imbalance areas, which can help place limit/stop orders more effectively as well as finding optimal points of interest beyond what the primary ICT Concepts features can generate for a trader.
In the above image we can see the Fibonacci extension was selected to be based on the NWOG giving us some upside levels above the buyside liquidity.
🔶 DETAILS
Each feature within the ICT Concepts indicator is described in the sub sections below.
🔹 Market Structure
Market structure labels are constructed from price breaking a prior swing point. This allows a user to determine the current market trend based on the price action.
There are two types of Market Structure labels included:
Market Structure Shift (MSS)
Break Of Structure (BOS)
A MSS occurs when price breaks a swing low in an uptrend or a swing high in a downtrend, highlighting a potential reversal. This is often labeled as "CHoCH", but ICT specifies it as MSS.
On the other hand, BOS labels occur when price breaks a swing high in an uptrend or a swing low in a downtrend. The occurrence of these particular swing points is caused by retracements (inducements) that highlights liquidity hunting in lower timeframes.
🔹 Order Blocks
More significant market participants (institutions) with the ability of placing large orders in the market will generally place a sequence of individual trades spread out in time. This is referred as executing what is called a "meta-order".
Order blocks highlight the area where potential meta-orders are executed. Bullish order blocks are located near local bottoms in an uptrend while bearish order blocks are located near local tops in a downtrend.
When price mitigates (breaks out) an order block, a breaker block is confirmed. We can eventually expect price to trade back to this breaker block offering a new trade opportunity.
🔹 Buyside & Sellside Liquidity
Buyside / Sellside liquidity levels highlight price levels where market participants might place limit/stop orders.
Buyside liquidity levels will regroup the stoploss orders of short traders as well as limit orders of long traders, while Sellside liquidity levels will regroup the stoploss orders of long traders as well as limit orders of short traders.
These levels can play different roles. More informed market participants might view these levels as source of liquidity, and once liquidity over a specific level is reduced it will be found in another area.
🔹 Imbalances
Imbalances highlight disparities between the bid/ask, these can also be defined as inefficiencies, which would suggest that not all available information is reflected by the price and would as such provide potential trading opportunities.
It is common for price to "rebalance" and seek to come back to a previous imbalance area.
ICT highlights multiple imbalance formations:
Fair Value Gaps: A three candle formation where the candle shadows adjacent to the central candle do not overlap, this highlights a gap area.
Implied Fair Value Gaps: Unlike the fair value gap the implied fair value gap has candle shadows adjacent to the central candle overlapping. The gap area is constructed from the average between the respective shadow and the nearest extremity of their candle body.
Balanced Price Range: Balanced price ranges occur when a fair value gap overlaps a previous fair value gap, with the overlapping area resulting in the imbalance area.
Volume Imbalance: Volume imbalances highlight gaps between the opening price and closing price with existing trading activity (the low/high overlap the previous high/low).
Opening Gap: Unlike volume imbalances opening gaps highlight areas with no trading activity. The low/high does not reach previous high/low, highlighting a "void" area.
🔹 Displacement
Displacements are scenarios where price forms successive candles of the same sentiment (bullish/bearish) with large bodies and short shadows.
These can more technically be identified by positive auto correlation (a close to open change is more likely to be followed by a change of the same sign) as well as volatility clustering (large changes are followed by large changes).
Displacements can be the cause for the formation of imbalances as well as market structure, these can be caused by the full execution of a meta order.
🔹 Kill Zones
Killzones represent different time intervals that aims at offering optimal trade entries. Killzones include:
- New York Killzone (7:9 ET)
- London Open Killzone (2:5 ET)
- London Close Killzone (10:12 ET)
- Asian Killzone (20:00 ET)
🔶 Conclusion & Supplementary Material
This script aims to emulate how a trader would draw each of the covered features on their chart in the most precise representation to how it's actually taught by ICT directly.
There are many parallels between ICT Concepts and Smart Money Concepts that we released in 2022 which has a more general & simpler usage:
ICT Concepts, however, is more specifically aligned toward the community's interpretation of how to analyze price 'based on ICT', rather than displaying features to have a more classic interpretation for a technical analyst.

Swing High Swing Low This tool is the swing high swing low indicator. A swing high/low is a technical pattern that describes a local peak or trough on a chart. By connecting these peaks and troughs, we can determine the general direction the asset is trading. This indicator can be used on all time frames and in any market.
To use it, declare how many candles are needed to determine a swing level. By default, the indicator is set to two candles. This means that a candle must have two candles to the right AND left (totaling 5 consecutive candles) to be considered a swing level. If the middle candle has the highest high of the 5 consecutive candles, it will be classified as a Swing High. If the middle candle has the lowest low, it will be a Swing Low. Otherwise, it will be ignored.
Once a swing number is declared, the indicator will look for a starting swing high and swing low. The asset will trade inside the range established by the swing high/low lines. When the lines are parallel, it is considered a form of consolidation. You will likely see a lot of whipsaw action or chart patterns like bullflags or head-shoulders. Wait patiently for a break of this consolidation. The indicator will identify the new swing levels when the asset breaks out of this range.
Depending on the direction of the break, it will turn green for an uptrend or red for a downtrend. You should look to take long positions when the lines are green and short when the lines are red. You can use old swing levels as support or resistance in the future. The longer the line, the greater the likelihood that it will be support or resistance. This can help you identify potential entries.
The goal of this script is to make it easier to determine trends. Sometimes, we take the wrong trade because we don't understand which way the market is trending and what levels are important. This indicator is meant to take the guesswork out and make the trade easy and emotionless. This indicator works well on its own, but I suggest pairing it with another to add an extra confirmation before taking a trade. Happy Trading!
**Please note: Assets that have traded parabolically (steep inclines or declines) will have wide ranges that may not be broken. (see GME 2021)**
ICT Institutional Order Flow (Riz)This indicator implements Inner Circle Trader (ICT) institutional order flow concepts to identify high-probability entry points where smart money is actively participating in the market. It combines volume analysis, market structure, and price action patterns to detect institutional accumulation and distribution zones.
Core Concepts & Methodology
1. Institutional Order Blocks Detection
Order blocks represent the last opposing candle before a strong directional move, indicating institutional accumulation (bullish) or distribution (bearish) zones.
How it works:
⦁ Identifies the final bearish candle before bullish expansion (accumulation)
⦁ Identifies the final bullish candle before bearish expansion (distribution)
⦁ Validates with volume spike (2x average) to confirm institutional participation
⦁ Requires minimum 0.5% price displacement to filter weak moves
⦁ Tracks these zones as future support/resistance levels
2. Fair Value Gap (FVG) Analysis
FVGs are price inefficiencies created by aggressive institutional orders that leave gaps in price action.
Detection method:
⦁ Bullish FVG: When current low > high from 2 bars ago
⦁ Bearish FVG: When current high < low from 2 bars ago
⦁ Minimum gap size filter (0.1% default) eliminates noise
⦁ Monitors gap fills with volume for entry signals
⦁ Gaps act as magnets drawing price back for "rebalancing"
3. Liquidity Hunt Detection
Institutions often trigger retail stop losses before reversing direction, creating liquidity for their positions.
Algorithm:
⦁ Calculates rolling 20-period highs/lows as liquidity pools
⦁ Detects wicks beyond these levels (0.1% sensitivity)
⦁ Identifies rejection back inside range (liquidity grab)
⦁ Volume spike confirmation ensures institutional involvement
⦁ These reversals often mark significant turning points
4. Volume Profile Integration
Analyzes volume distribution across price levels to identify institutional interest zones.
Components:
⦁ Point of Control (POC): Price level with highest volume (institutional consensus)
⦁ Value Area: 70% of volume range (institutional comfort zone)
⦁ Uses 50-bar lookback to build volume histogram
⦁ 20 price levels for granular distribution analysis
5. Market Structure Analysis
Determines overall trend bias using pivot points and swing analysis.
Process:
⦁ Identifies swing highs/lows using 3-bar pivots
⦁ Bullish structure: Price above last swing high
⦁ Bearish structure: Price below last swing high
⦁ Filters signals to trade with institutional direction
Signal Generation Logic
BUY signals trigger when ANY condition is met:
1. Order Block Formation: Bearish-to-bullish transition + volume spike + strong move
2. Liquidity Grab Reversal: Sweep below lows + recovery + volume spike
3. FVG Fill: Price fills bullish gap with institutional volume (within 3 bars)
4. Order Block Respect: Price bounces from previous bullish OB + volume
SELL signals trigger when ANY condition is met:
1. Order Block Formation: Bullish-to-bearish transition + volume spike + strong move
2. Liquidity Grab Reversal: Sweep above highs + rejection + volume spike
3. FVG Fill: Price fills bearish gap with institutional volume (within 3 bars)
4. Order Block Respect: Price rejects from previous bearish OB + volume
Additional filters:
⦁ Signals align with market structure (no counter-trend trades)
⦁ No new signals while position is active
⦁ All signals require volume confirmation (institutional fingerprint)
Trading Style Auto-Configuration
The indicator features intelligent preset configurations for different trading styles:
Scalping Mode (1-5 min charts):
⦁ Volume multiplier: 1.5x (more signals)
⦁ Tighter parameters for quick trades
⦁ Risk:Reward 1.5:1, ATR multiplier 1.0
Day Trading Mode (15-30 min charts):
⦁ Volume multiplier: 1.7x (balanced)
⦁ Medium sensitivity settings
⦁ Risk:Reward 2:1, ATR multiplier 1.5
Swing Trading Mode (1H-4H charts):
⦁ Volume multiplier: 2.0x (quality focus)
⦁ Conservative parameters
⦁ Risk:Reward 3:1, ATR multiplier 2.0
Custom Mode:
⦁ Full manual control of all parameters
Visual Components
⦁ Order Blocks: Colored rectangles (green=bullish, red=bearish)
⦁ Fair Value Gaps: Orange boxes showing imbalances
⦁ Liquidity Levels: Dashed blue lines at key highs/lows
⦁ Volume Spikes: Yellow background highlighting
⦁ POC Line: Orange line showing highest volume price
⦁ Value Area: Blue shaded zone of 70% volume
⦁ Buy/Sell Signals: Triangle markers with text labels
⦁ Stop Loss/Take Profit: Dotted lines (red/green)
Information Panel
Real-time dashboard displaying:
⦁ Current trading mode
⦁ Volume ratio (current vs average)
⦁ Market structure (bullish/bearish)
⦁ Active order blocks count
⦁ Position status
⦁ Configuration details
How to Use
Step 1: Select Trading Style
Choose your style in settings - all parameters auto-adjust
Step 2: Timeframe Selection
⦁ Scalping: 1-5 minute charts
⦁ Day Trading: 15-30 minute charts
⦁ Swing: 1H-4H charts
Step 3: Signal Interpretation
⦁ Wait for BUY/SELL markers
⦁ Check volume ratio >2 for strong signals
⦁ Verify market structure alignment
⦁ Note automatic SL/TP levels
Step 4: Risk Management
⦁ Default 2:1 risk:reward (adjustable)
⦁ Stop loss: 1.5x ATR from entry
⦁ Position sizing based on stop distance
Best Practices
1. Higher probability setups occur when multiple conditions align
2. Volume confirmation is crucial - avoid signals without volume spikes
3. Trade with structure - longs in bullish, shorts in bearish structure
4. Monitor POC - acts as dynamic support/resistance
5. Confluence zones where OBs, FVGs, and liquidity levels overlap are strongest
Important Notes
⦁ Not a standalone system - combine with your analysis
⦁ Works best in trending markets with clear structure
⦁ Adjust settings based on instrument volatility
⦁ Backtest thoroughly on your specific markets
⦁ Past performance doesn't guarantee future results
Alerts Available
⦁ ICT Buy Signal
⦁ ICT Sell Signal
⦁ Volume Spike Detection
⦁ Liquidity Grab Detection
This indicator provides a systematic approach to ICT concepts, helping traders identify where institutions are entering positions through volume analysis and key price action patterns. The auto-configuration feature ensures optimal settings for your trading style without manual adjustment.
Disclaimer
This tool is for educational and research purposes only. It is not financial advice, nor does it guarantee profitability. All trading involves risk, and users should test thoroughly before applying live.

Simple Auto Swing Lines# Simple Auto Swing Lines
## What It Does
This indicator automatically draws horizontal support and resistance lines based on swing highs and lows with line management and touch-based alerts.
## How It Works
**Swing Detection:**
- Uses pivot point analysis to identify significant highs and lows
- Configurable pivot strength determines sensitivity (higher = more significant swings)
- Draws horizontal lines from these swing points extending to current price
**Line Management:**
- Proximity Filter: Removes lines that are too close together to prevent clutter
- Auto-Hide Feature: Lines disappear after price closes beyond them for a set number of candles
- Permanent Clipping: Once a line is crossed for the threshold period, it stays hidden
- Dynamic Updates: Only shows the most relevant recent swing levels
**Touch-Based Alert System:**
- "Swing High touched" - Alerts when price touches resistance lines from any direction
- "Swing Low touched" - Alerts when price touches support lines from any direction
- "Any Swing Level touched" - Combined alert for any swing line interaction
## Key Settings
**Pivot Detection:**
- Pivot Strength (50): Higher values = fewer, more significant swing lines
- Max Lookback Bars (1000): How far back to look for swing points
**Line Appearance:**
- Max Lines (5): Maximum number of swing lines per side (total lines = 2x this number)
- Line Thickness (1-5): Customize line width
- Resistance/Support Colors: Red for highs, green for lows
- Show Labels: Optional swing high/low labels (default: off)
**Display Controls:**
- Proximity Filter (2000 ticks): Minimum distance between lines to prevent clutter
- Candles Before Hide (7): How many consecutive closes beyond a line before permanent removal
SMC Swing Lines • Core v0.2.6SMC Swing Lines • Core v0.2.6
Purpose
SMC Swing Lines • Core plots objective swing‐based levels used in Smart Money Concepts. The script identifies recent swing highs/lows and projects them as horizontal “liquidity lines” that persist until invalidation (break) or mitigation (touch/retest). It is designed to give a clean structural map for EQH/EQL clusters, sweeps, and level-to-level delivery, without signals or forecasting.
What it plots
Swing High / Swing Low lines – drawn from confirmed pivots.
Status-aware styling – fresh (active) vs mitigated levels can use different line styles/widths/colors.
Optional zones – lines may be displayed as narrow boxes (wick or full range) to reflect the chosen swing area.
Lookback control – limit historical levels by days/bars to keep charts readable.
Notes
• Pivots confirm only after the selected lookback completes; lines are created on confirmation.
• Lines extend to the right until a mitigation/invalidating close, according to your settings.
How it detects swings
Pivot length (L/R): a symmetric left/right bar count forms a pivot.
Area mode:
Wick Extremity – uses absolute high/low (best for liquidity sweeps).
Full Range – uses the candle’s full range/body (stricter structure).
Inputs (key settings)
Pivot Lookback – bars left/right to confirm a swing.
Swing Area – Wick Extremity or Full Range.
Extend Until Fill – keep a level alive until price trades through/taps it (mitigation).
Hide Filled – remove lines once mitigated to reduce clutter.
Line Style & Width – separate styles for highs/lows and for fresh vs mitigated.
Colors – independent high/low/zone colors.
Labels (optional) – minimal markers for visual anchoring.
Lookback Window – limit by bars or days (performance & clarity).
(Exact control names in the panel may use concise variants of the labels above.)
Alerts (optional)
Mitigation / Touch – alert when price interacts with an active line.
Confirmation timing – alerts are designed to evaluate on bar close for reliability.
TradingView Alerts → “Create Alert” → condition: SMC Swing Lines • Core → choose the relevant event and your timeframe.
Recommended use
Timeframes: works from intraday to HTF. Typical ranges:
Intraday (3–15m): Pivot 3–7
Swing (30m–4h): Pivot 5–15
HTF (6h–1D+): Pivot 10–25
Area choice:
Wick Extremity to highlight liquidity grabs/sweeps.
Full Range when you want stricter structure mapping.
Chart hygiene: enable “Hide Filled” or reduce lookback to manage density.
Limitations & behavior
Pivot confirmation: swings appear only after the right-side lookback completes; this is not a “leading” signal.
No strategy component: the script does not generate entries/exits or claims of edge—use it as a structural map alongside your own trade plan (e.g., FVG/OB filters, session timing, volume context).
MTF: if you project higher-TF context via separate layouts, remember that lower-TF price can interact with HTF lines intrabar before the HTF bar closes.
Changelog (Core 0.2.6)
Stability & styling refinements for active vs mitigated levels.
Consistent alerting on bar close.
Minor UI text and default presets cleanup.
Sweep2Trade Pro [CHE]Sweep2Trade Pro \ — Liquidity Sweep → Trend → Confirmation
Sweep2Trade Pro \ helps you catch high-probability reversals or continuations that start with a liquidity sweep, align with the T3 trend, and finalize with a structure confirmation (BOS). It’s designed to reduce noise, time your entries, and keep you out of weak, chop-driven signals.
What’s a “sweep”?
A liquidity sweep happens when price briefly breaks a prior swing high/low (where many stops sit), triggers those stops, and then snaps back. This “stop-hunt” creates liquidity for bigger players and often precedes a sharp move in the opposite direction if the break fails, or fuels continuation if structure actually shifts.
What’s a BOS (Break of Structure)?
A BOS is a price action event where the market takes out a recent swing level in the trend’s direction, signaling continuation and confirming that structure has shifted (bullish BOS through a recent swing high, bearish BOS through a recent swing low).
How the indicator works (at a glance)
1. Regime Filter (T3 + R²)
T3 Moving Average: A smoother, faster-responding moving average that aims to reduce lag while filtering noise, so trend direction changes are clearer.
R² (Coefficient of Determination): Measures how “linear” the recent price path is (0→1). Higher values = stronger, cleaner trend; lower values = more chop. Used here to allow trades only when trend quality exceeds a user-set threshold.
2. Sweep Detection
Bullish sweep: price pokes below a prior swing low and closes back above it.
Bearish sweep: price pokes above a prior swing high and closes back below it.
Lookback length is configurable.
3. Sequence Lock (built-in FSM)
The script manages state in phases so you don’t jump the gun:
Phase 1: Sweep detected → wait for T3 to turn in the corresponding direction.
Phase 2: T3 direction confirmed → show “SWEEP OK” and wait for final confirmation.
Trade Signal: Only fires if confirmation arrives before a timeout.
4. Confirmation Layer
BOS via wick or close (you choose),
Strong close toward the signal (top/bottom quartile of the candle),
Optional “close above/below T3” condition.
These checks help avoid weak sweeps that immediately fade.
5. Alerts & Visuals
“SWEEP OK” markers show when the sweep + T3 direction align.
Final BUY/SELL arrows appear only when the confirmation layer passes.
Ready-made alert conditions for automation.
What you can do with it
Time reversals after sweeps: Enter when a stop-hunt fades and structure confirms.
Ride continuations: Use BOS with the T3 trend to pyramid or re-enter with structure on your side.
Filter chop: Let R² gate entries to periods with cleaner directional drift.
Automate: Use the included alerts with your platform or webhook setup.
Inputs (key settings)
Regime Filter
T3 Length / Volume Factor: Controls smoothness and responsiveness. Smaller length → faster, more sensitive; higher volume factor → smoother curve.
R² Lookback & Threshold: Length of the linear fit window and the minimum “trend quality” required. Higher thresholds mean fewer, cleaner signals.
Sweep / Sequence
Swing Lookback: How far back to define the “reference” high/low for sweeps.
Timeout: Maximum bars allowed between phases to keep signals fresh.
Restart timeout on Phase 2: Optional safety so entries don’t go stale.
Confirmation
BOS Lookback: Micro-pivot window for structure breaks.
Wick vs Close BOS: Conservative traders may prefer close.
Require close above/below T3: Tightens confirmation with trend alignment.
Practical guide (quick start)
1. Timeframe & markets: Works across majors, indices, and crypto. Start with 5m–1h intraday or 1h–4h swing; adjust R² threshold upward on noisier pairs.
2. Entry recipe (Long):
Bullish sweep of a prior low → T3 turns up → BOS/strong close.
Optional: enable “close above T3” for extra confirmation.
3. Entry recipe (Short): Mirror the above.
4. Stops: Common choices are just beyond the sweep wick (tighter) or past the BOS invalidation (safer).
5. Targets: Previous structural levels, measured move, or a T3 trail (exit when price closes back through T3).
6. Avoid low-quality contexts: If R² is very low, market is likely ranging erratically—skip or widen filters.
Tips & best practices
Context first: The same sweep means different things in a strong trend vs. flat regime; that’s why the T3+R² filter exists.
BOS choice: Wick-based BOS is earlier but noisier; close-based BOS is slower but cleaner. Tune per market.
Backtest -> Forward test: Validate settings per symbol/timeframe; then paper trade before going live.
Risk: Fixed fractional risk with asymmetric R\:R (e.g., 1:1.5–1:3) generally performs better than “all-in” discretionary sizing.
Behind the scenes (for the curious)
T3 is a multi-stage EMA construction that produces a smooth curve with reduced lag versus simple/standard EMAs.
R² is the square of correlation (0–1). Here it’s used as a moving gauge of how well price aligns to a linear path—our “trend quality” dial.
Stop-hunts / sweeps are a recognized microstructure phenomenon where clustered stops provide the liquidity that fuels the next move.
Disclaimer
No indicator guarantees profits. Sweep2Trade Pro \ is a decision aid; always combine with solid risk management and your own judgment. Backtest, forward test, and size responsibly.
The content provided, including all code and materials, is strictly for educational and informational purposes only. It is not intended as, and should not be interpreted as, financial advice, a recommendation to buy or sell any financial instrument, or an offer of any financial product or service. All strategies, tools, and examples discussed are provided for illustrative purposes to demonstrate coding techniques and the functionality of Pine Script within a trading context.
Any results from strategies or tools provided are hypothetical, and past performance is not indicative of future results. Trading and investing involve high risk, including the potential loss of principal, and may not be suitable for all individuals. Before making any trading decisions, please consult with a qualified financial professional to understand the risks involved.
By using this script, you acknowledge and agree that any trading decisions are made solely at your discretion and risk.
Enhance your trading precision and confidence 🚀
Happy trading
Chervolino
